Fig. 9
Download original image
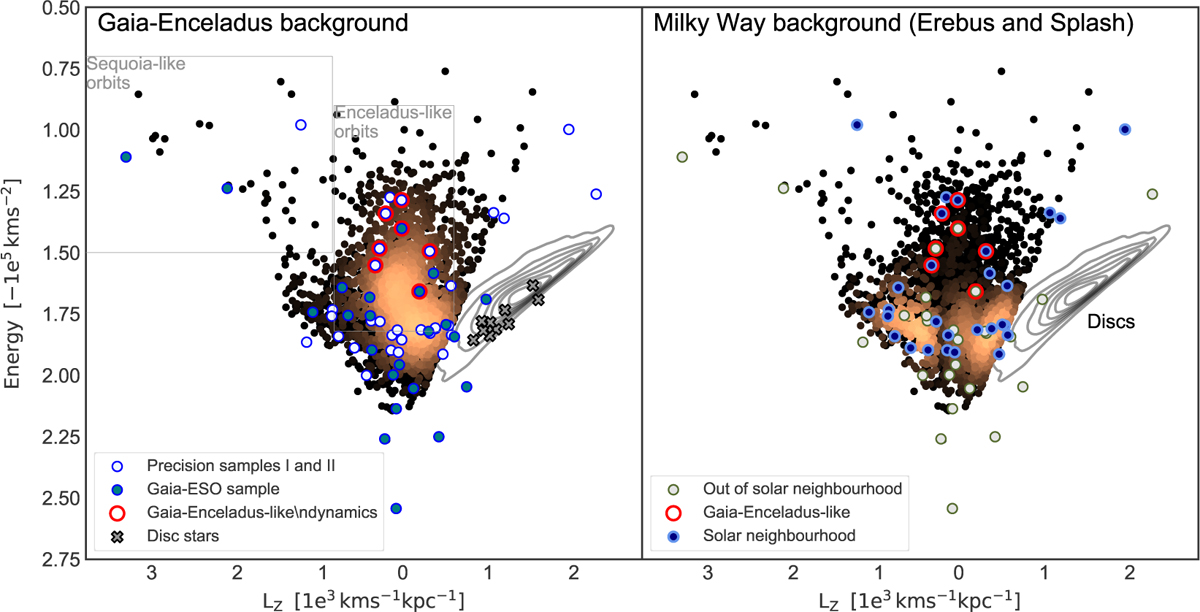
Lindblad diagrams (energy vs. LZ ): the halo stars of the GALAH survey are plotted as reference background, colour-coded by density; in each panel the colour-map emphasises the Gaia-Enceladus and Milky Way (Erebus and Splash) populations, respectively, using the separation in Giribaldi & Smiljanic (2023). Left panel: precision samples and the Gaia-ESO sample (represented with the same symbols as in Fig. 2). The boxes enclose the areas with the highest probability of containing Gaia-Enceladus and Sequoia stars according to Massari et al. (2019). The red circles indicate stars with Gaia-Enceladus-like dynamics in the current sample. Right panel: stars in and out of the solar neighbourhood (distinguished by different coloured symbols). The stars with Gaia-Enceladus-like orbits are highlighted.
Current usage metrics show cumulative count of Article Views (full-text article views including HTML views, PDF and ePub downloads, according to the available data) and Abstracts Views on Vision4Press platform.
Data correspond to usage on the plateform after 2015. The current usage metrics is available 48-96 hours after online publication and is updated daily on week days.
Initial download of the metrics may take a while.