Fig. 8
Download original image
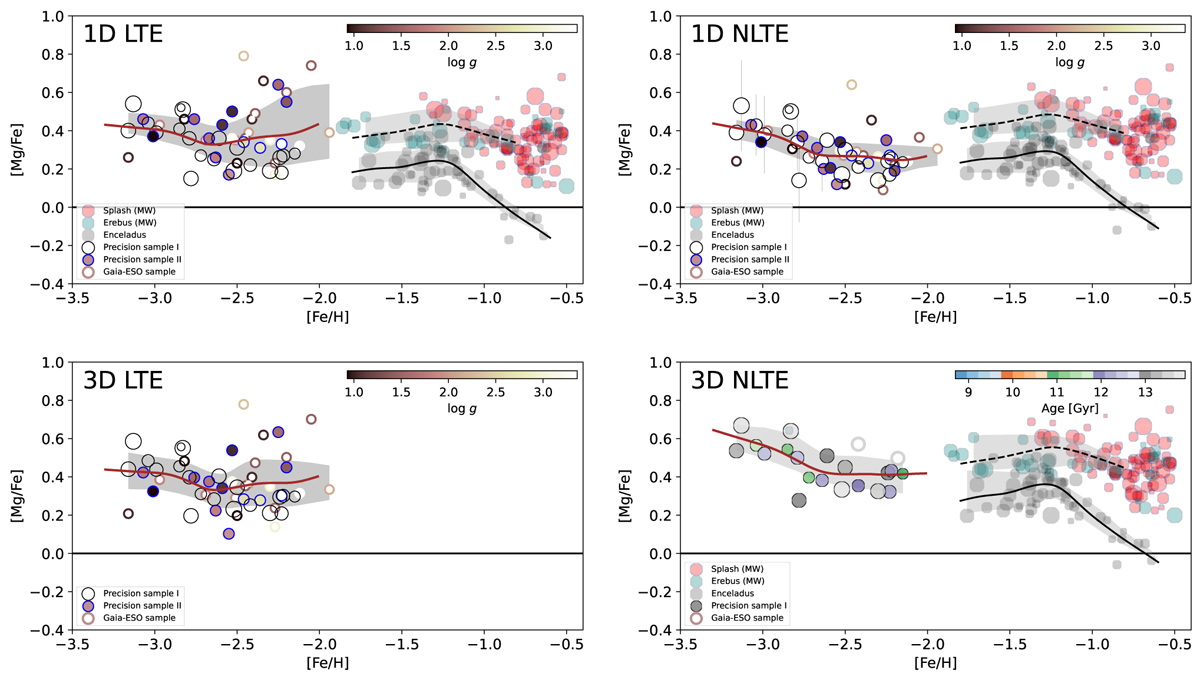
[Mg/Fe] vs. [Fe/H] for our sample stars: 1D LTE, 1D NLTE, 3D LTE, and 3D NLTE abundances are displayed according to the legends; all panels are built with [Fe/H] under 1D NLTE. The symbols representing the dwarfs are size-coded according to their ages. As a reference, stars classified as the in situ populations Splash (red) and Erebus (turquoise), and the ex situ population Gaia-Enceladus (grey) in Giribaldi & Smiljanic (2023) are plotted. The solid red, dashed black, and solid black lines display the LOWESS regressions. The shades display 20 to 80% quantiles. Bottom right panel: only dwarfs are displayed, as only these have 3D NLTE corrections. They are colour-coded according to age. Other panels: precision sample I (only dwarfs) has no colour-coding. The Precision sample II and Gaia-ESO sample are colour-codded according to log g. Their symbols follow the legends in the plots. The panel 1D NLTE displays the error bars of the stars in Precision samples I and II with errors larger than 0.14 dex.
Current usage metrics show cumulative count of Article Views (full-text article views including HTML views, PDF and ePub downloads, according to the available data) and Abstracts Views on Vision4Press platform.
Data correspond to usage on the plateform after 2015. The current usage metrics is available 48-96 hours after online publication and is updated daily on week days.
Initial download of the metrics may take a while.