Open Access
Fig. 7
Download original image
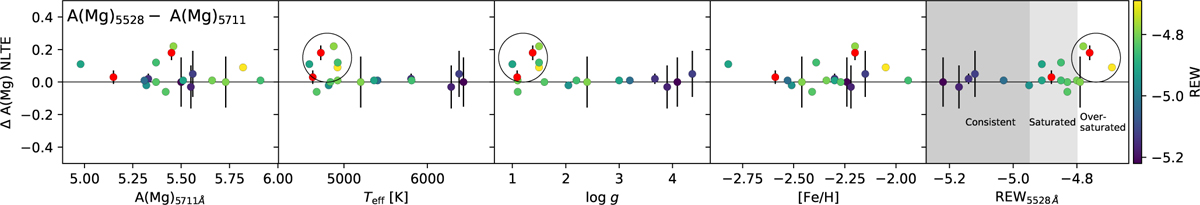
NLTE abundance differences from each line. The error bars are fitting errors related to the noise added in quadrature; only those lower than 0.2 dex are shown. The large circles indicate the parameter regions with the largest offsets. The red dots indicate the stars HD 122563 and BD+09 2870.
Current usage metrics show cumulative count of Article Views (full-text article views including HTML views, PDF and ePub downloads, according to the available data) and Abstracts Views on Vision4Press platform.
Data correspond to usage on the plateform after 2015. The current usage metrics is available 48-96 hours after online publication and is updated daily on week days.
Initial download of the metrics may take a while.