Fig. 6
Download original image
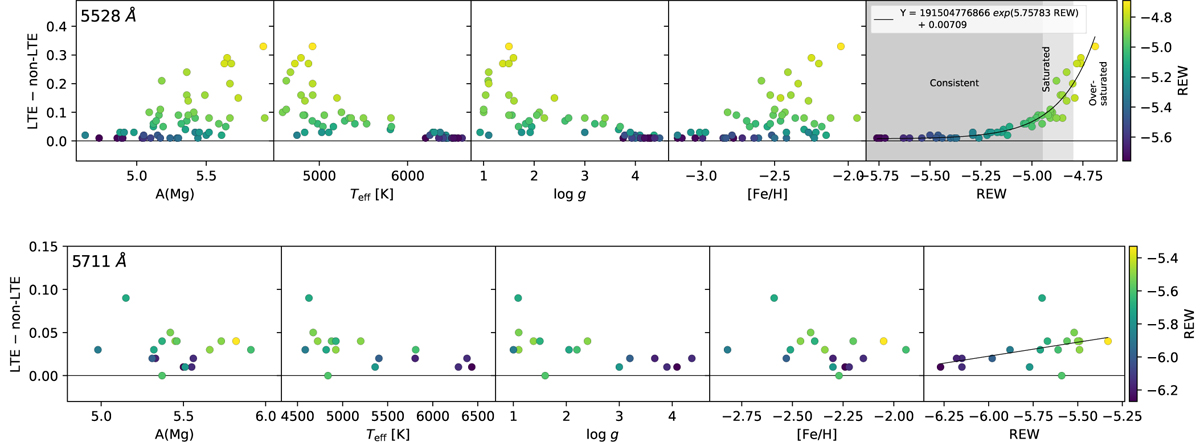
Comparison between 1D LTE and 1D NLTE Mg determination. Top panels: difference between 1D LTE and 1D NLTE abundance as function of atmospheric parameters, abundance, and REW for the line at 5528 Å. The rightmost panel displays an exponential function fitted to the dispersion, its coefficients are given in the plot. The shade areas cover three regions of REW: consistent (R E W<−4.95), saturated (−4.95 ≤ R E W<−4.80 ), and over-saturated ( R E W>−4.8 ) (see main text for explanation). Dispersions of the points around the fitted function are 0.0072 (consistent region), 0.0399 (saturated region), and 0.0397 dex (over-saturated region). Bottom panel: similar to the top panel, but for the line at 5511 Å.
Current usage metrics show cumulative count of Article Views (full-text article views including HTML views, PDF and ePub downloads, according to the available data) and Abstracts Views on Vision4Press platform.
Data correspond to usage on the plateform after 2015. The current usage metrics is available 48-96 hours after online publication and is updated daily on week days.
Initial download of the metrics may take a while.