Fig. 5
Download original image
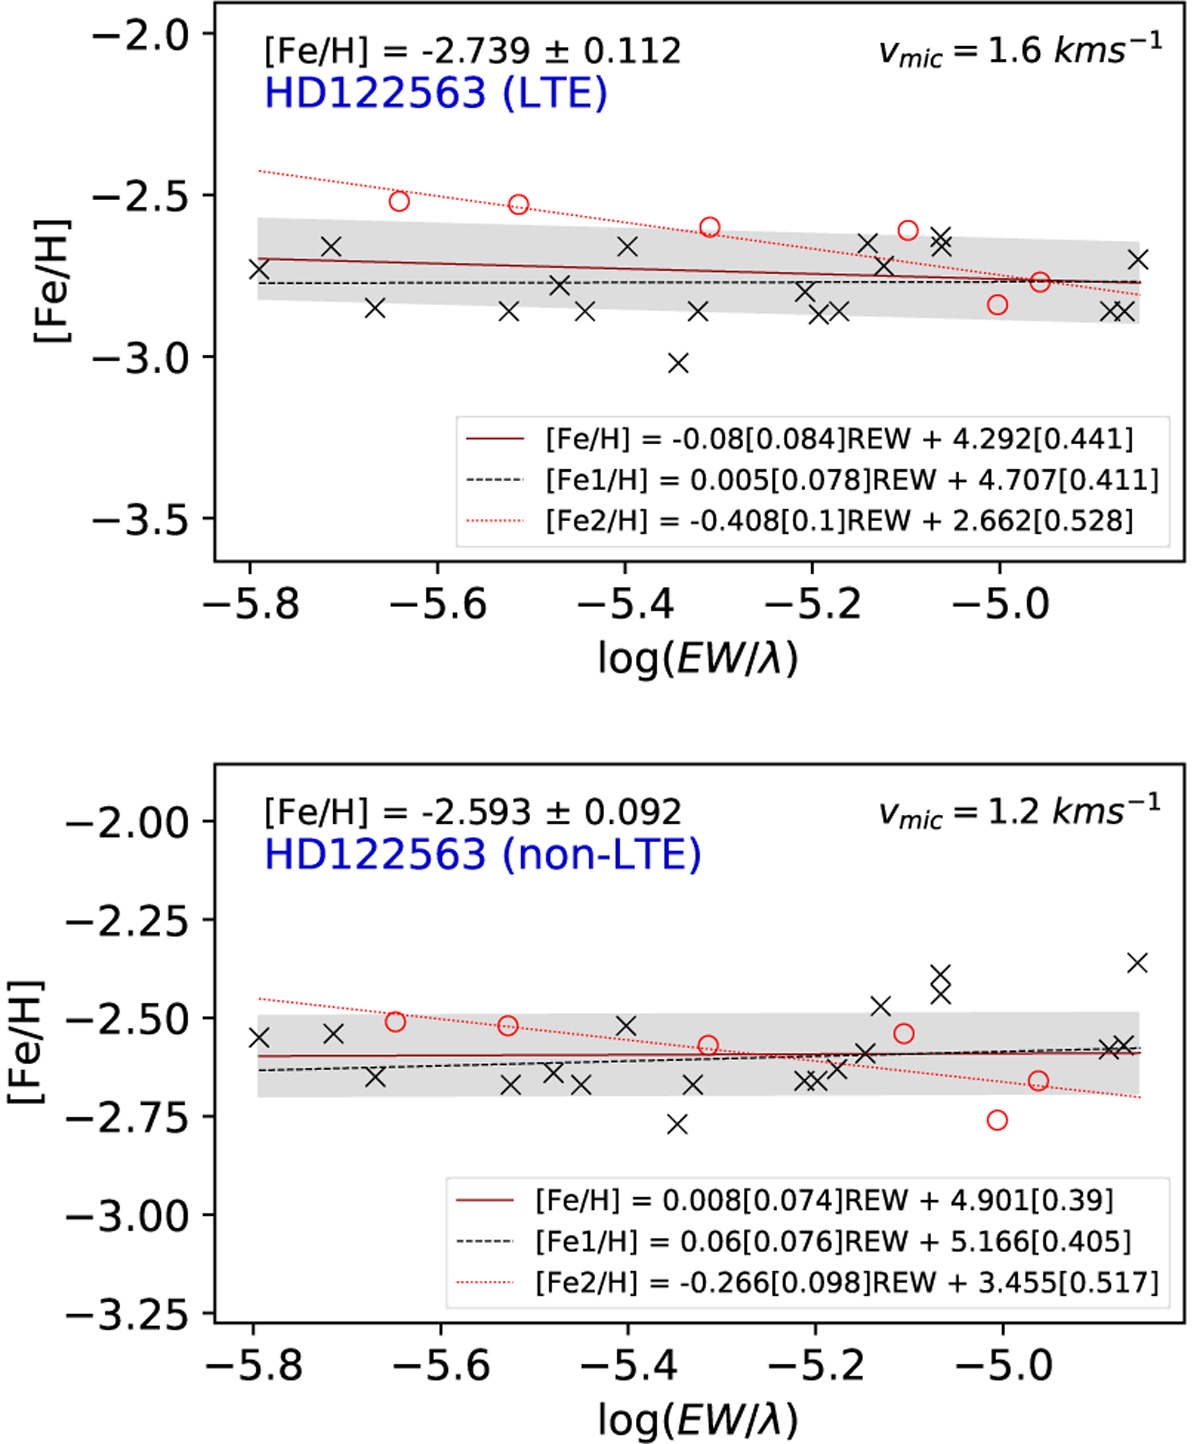
Ionisation equilibrium of the benchmark star HD 122563. The top and bottom panels display [Fe/H] and vmic determination under LTE and NLTE respectively. The crosses and circles indicate neutral and ionised species, respectively. Linear regressions corresponding to each species are displayed by different line styles (see legends for, where the values in brackets are the errors of the coefficients). The red line represents the regression of the neutral and ionised species together, the shade is the 1σ standard deviation. Determined [Fe/H] and vmic values are given in the plots.
Current usage metrics show cumulative count of Article Views (full-text article views including HTML views, PDF and ePub downloads, according to the available data) and Abstracts Views on Vision4Press platform.
Data correspond to usage on the plateform after 2015. The current usage metrics is available 48-96 hours after online publication and is updated daily on week days.
Initial download of the metrics may take a while.