Fig. 2
Download original image
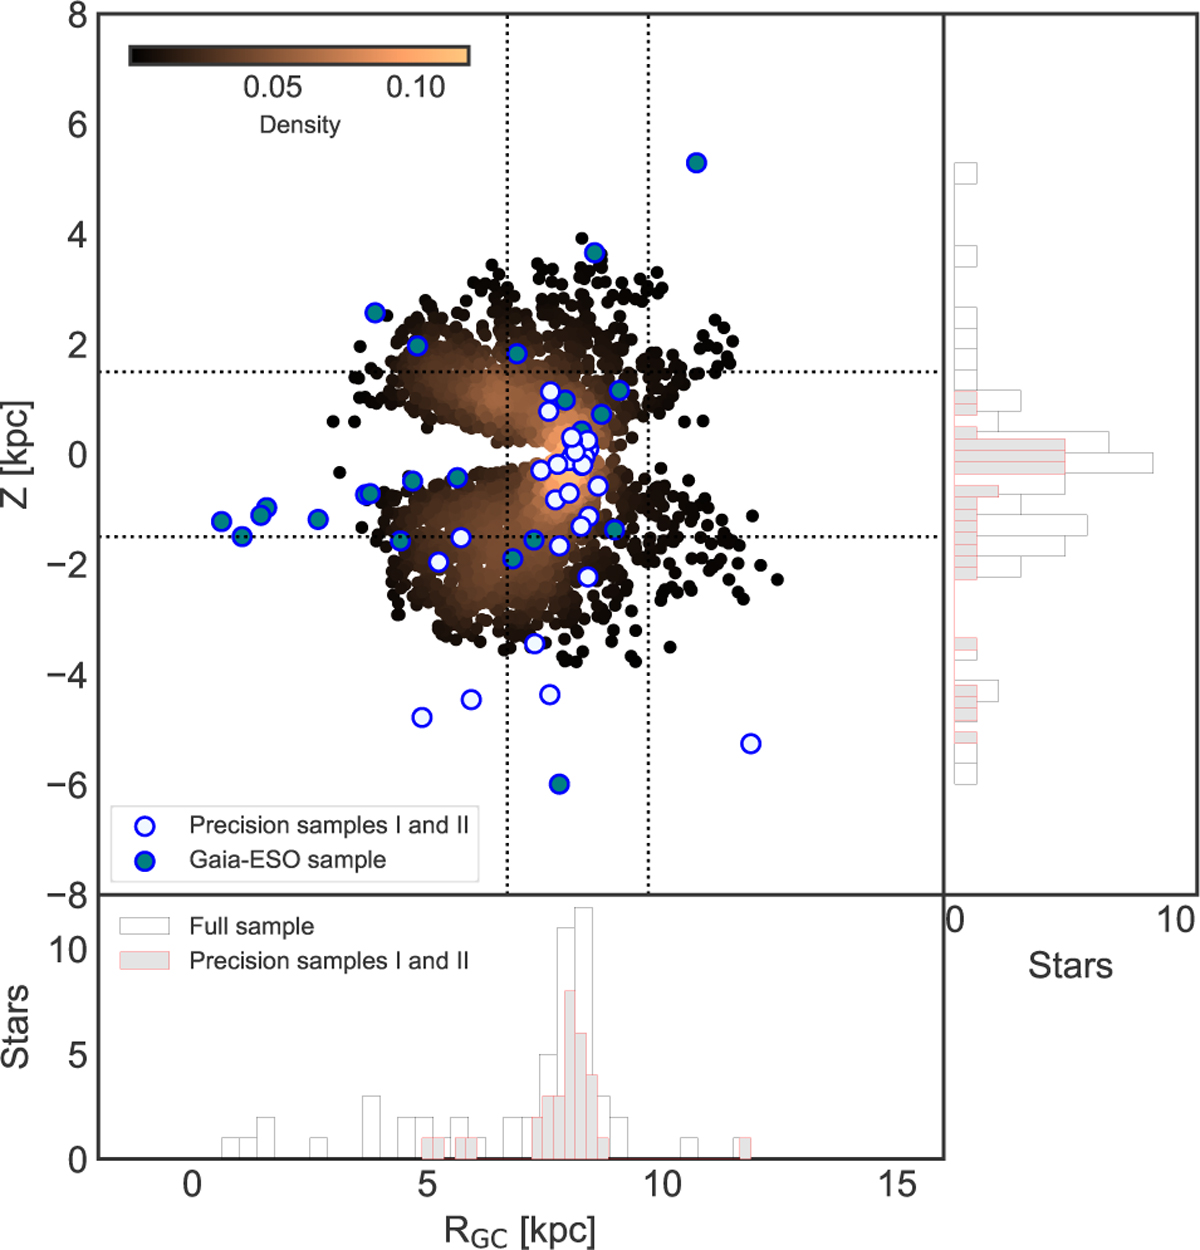
Spatial distribution of our sample stars with respect to the Galaxy centre. The colours of the symbols distinguish the Precision samples (empty circles) and the Gaia-ESO sample (filled blue circles). A sample of 6250 halo stars of the GALAH survey are plotted as reference background, colour-coded by density. The dotted lines indicate Z⊙ ± 1.5 and RGC ⊙ ± 1.5 kpc. Histograms of the distribution in RGC and Z of the full and the Precision samples I and II are displayed.
Current usage metrics show cumulative count of Article Views (full-text article views including HTML views, PDF and ePub downloads, according to the available data) and Abstracts Views on Vision4Press platform.
Data correspond to usage on the plateform after 2015. The current usage metrics is available 48-96 hours after online publication and is updated daily on week days.
Initial download of the metrics may take a while.