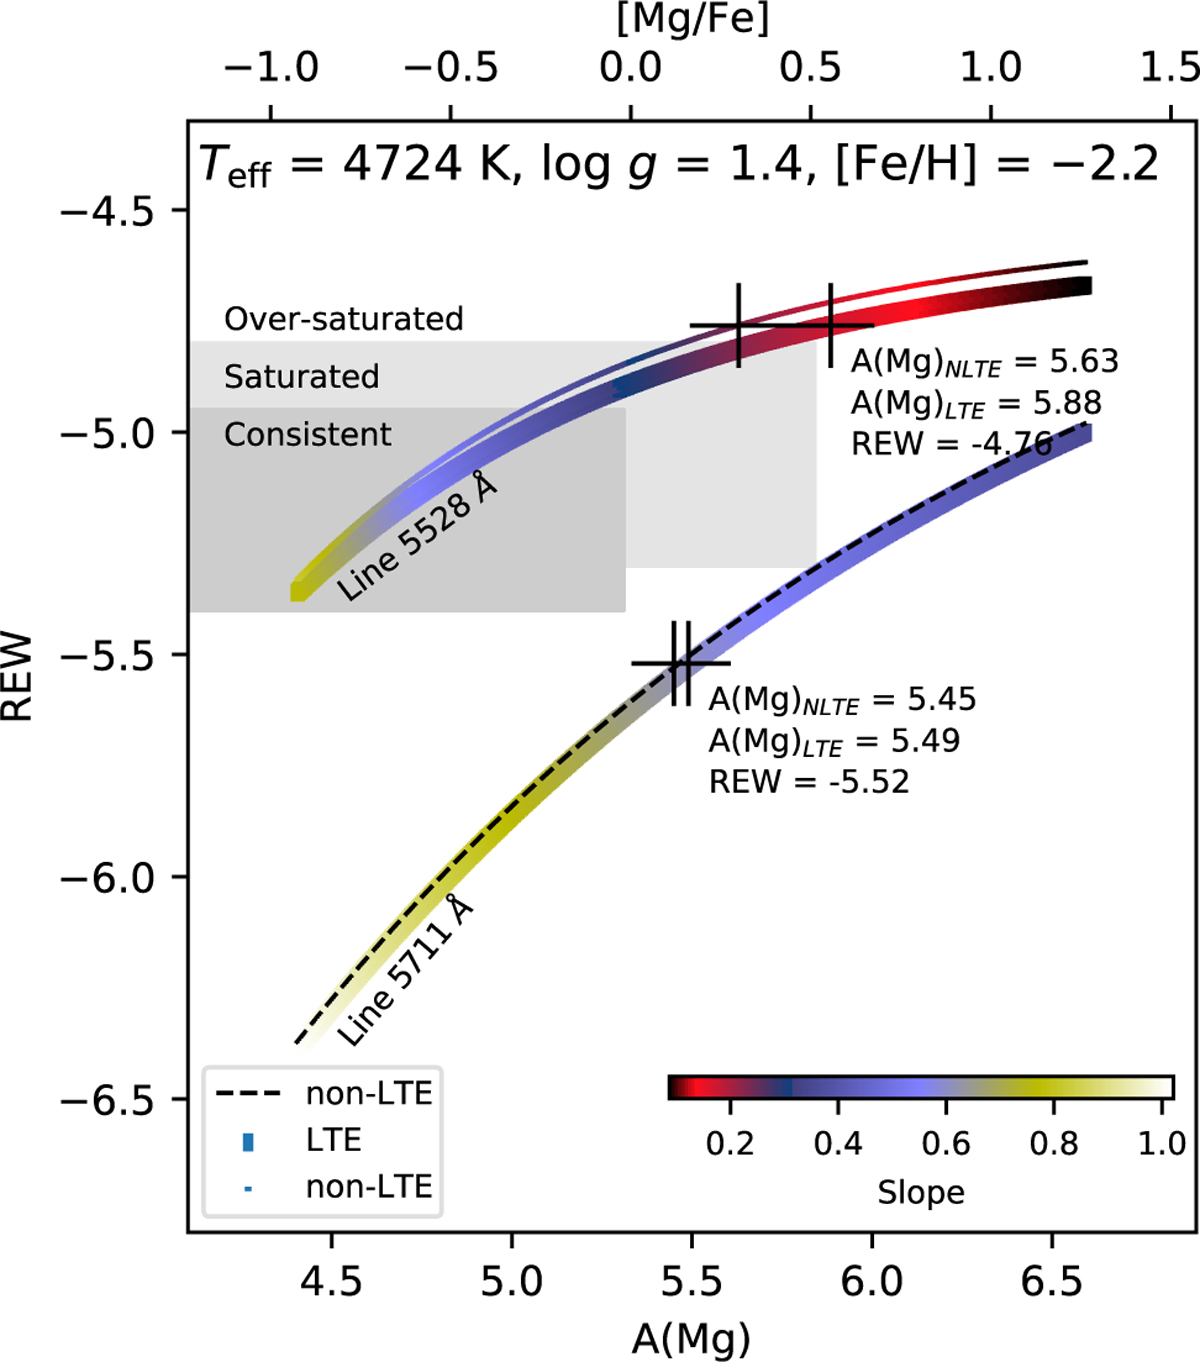
Fig. B.1
Download original image
Theoretical curves of growth of the Mg lines at 5528 and 5711 Å. The curves correspond to the star BD+09 2870, the parameters of which are given in the plot. The thick and thin lines represent NLTE and LTE, respectively. The NLTE curve of the line at 5711 Å is marked by the dashed line. The crosses symbols indicate REW and corresponding Mg abundances in LTE and NLTE for each line; values are noted in the plot.
Current usage metrics show cumulative count of Article Views (full-text article views including HTML views, PDF and ePub downloads, according to the available data) and Abstracts Views on Vision4Press platform.
Data correspond to usage on the plateform after 2015. The current usage metrics is available 48-96 hours after online publication and is updated daily on week days.
Initial download of the metrics may take a while.