Fig. A.6
Download original image
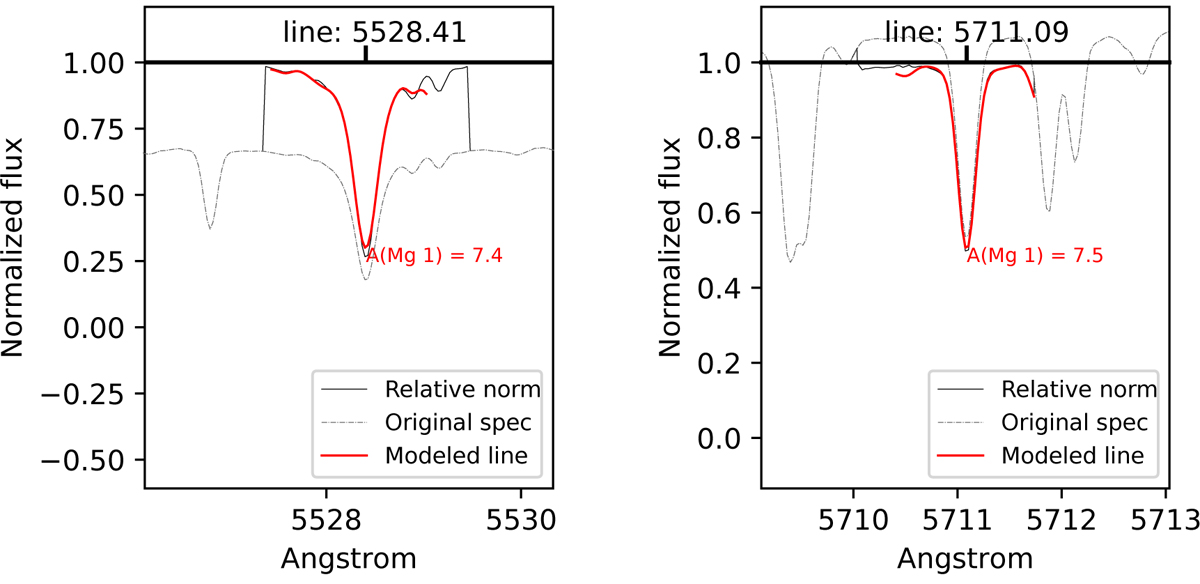
Mg line fits in the solar spectrum reflected in Ganymede. The dashed line represents the observed spectrum normalised by our automatic pipeline. It shows obvious flux mislocation with respect to the unity. The continuous black line displays the spectrum re-normalised on the fly by our line-fitting algorithm, which uses the pseudo-continuum of the synthetic spectrum (red line) as the flux reference. Abundances recovered by fitting are noted in the plots.
Current usage metrics show cumulative count of Article Views (full-text article views including HTML views, PDF and ePub downloads, according to the available data) and Abstracts Views on Vision4Press platform.
Data correspond to usage on the plateform after 2015. The current usage metrics is available 48-96 hours after online publication and is updated daily on week days.
Initial download of the metrics may take a while.