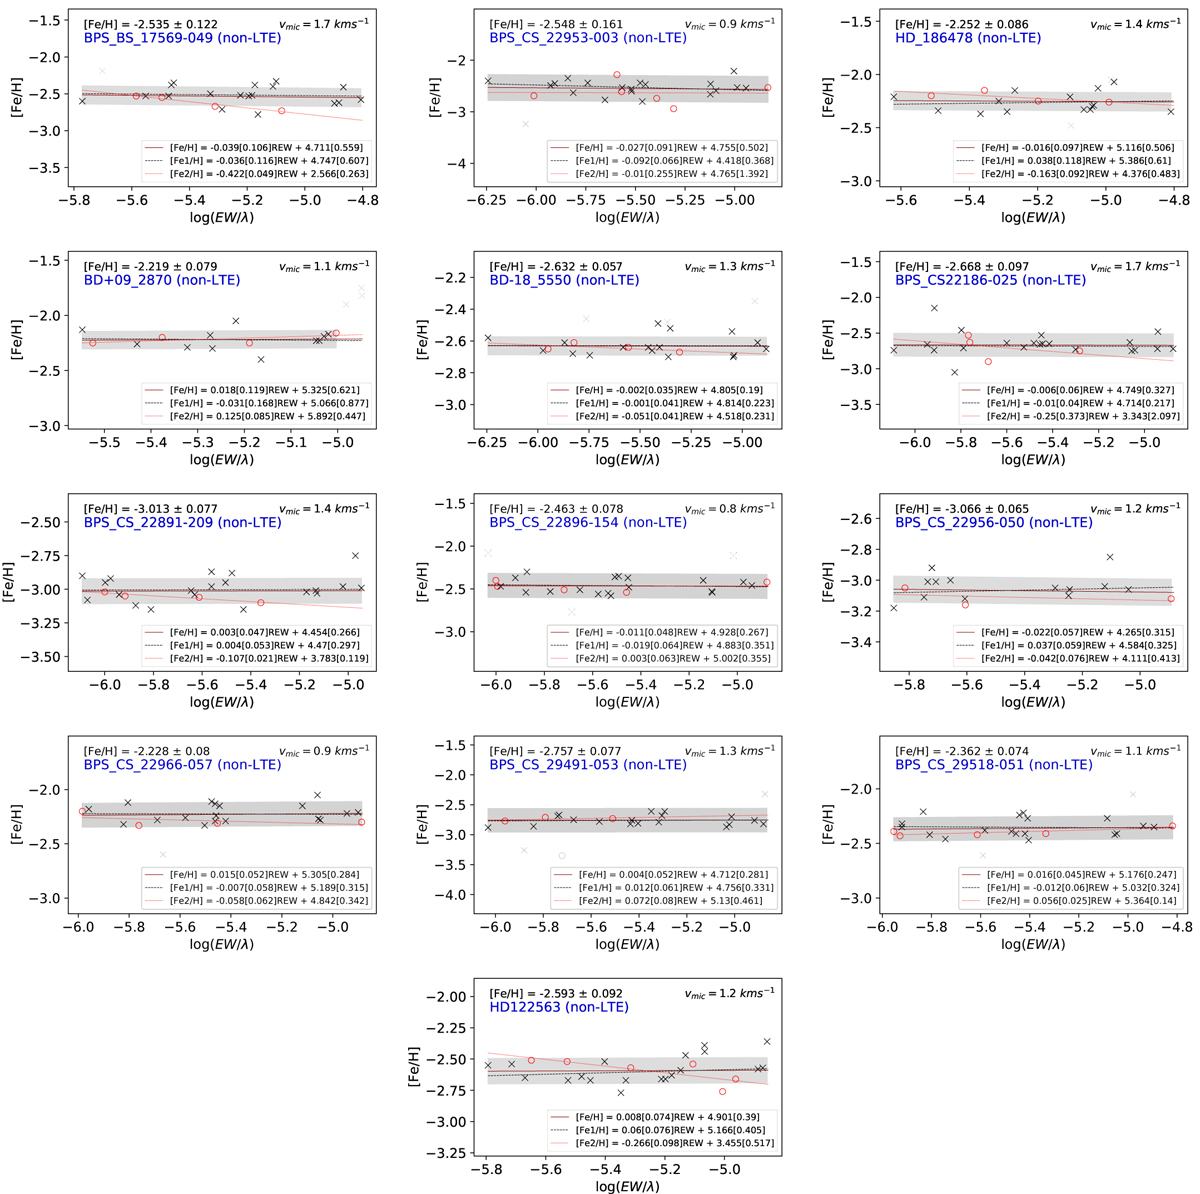
Fig. A.4
Download original image
Determination of metallicity and microturbulence of stars of Precision sample II. The abundances of Fe I lines are represented by cross symbols, whereas those of Fe II are represented by red circles. Regressions of each species are represented by the black dotted and red dotted lines, respectively. The red line represents the regression of both Fe I and Fe II species together. The shade represents 1σ dispersion. Regressions are computed considering 2σ clipping.
Current usage metrics show cumulative count of Article Views (full-text article views including HTML views, PDF and ePub downloads, according to the available data) and Abstracts Views on Vision4Press platform.
Data correspond to usage on the plateform after 2015. The current usage metrics is available 48-96 hours after online publication and is updated daily on week days.
Initial download of the metrics may take a while.