Fig. A.2
Download original image
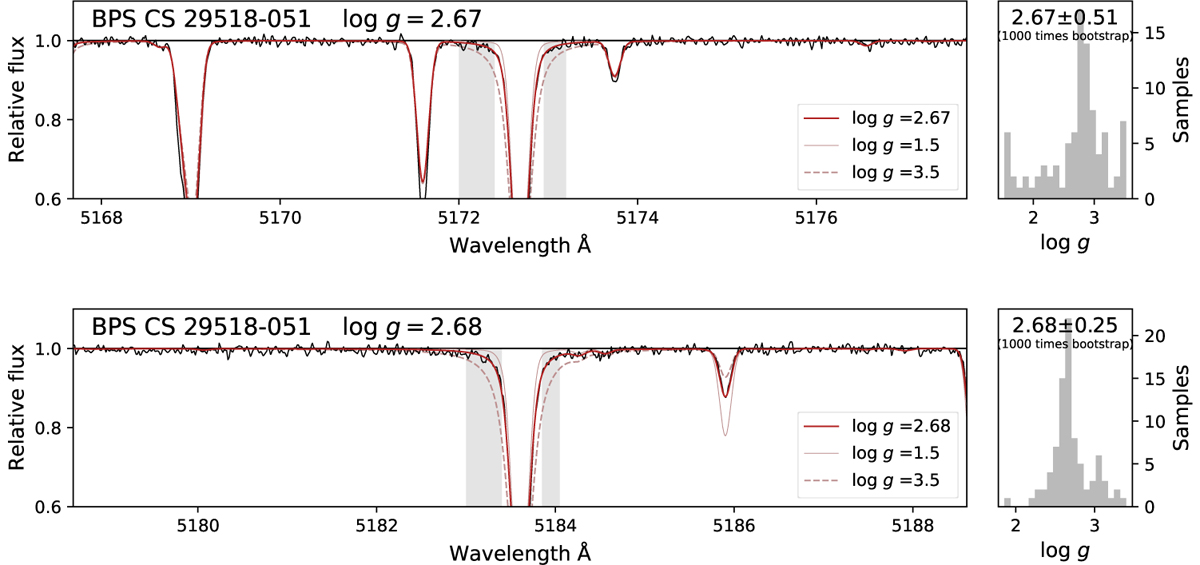
Magnesium profile fits of the star BPS CS 29518−051. The observational profile is represented in black. The red lines represent synthetic profiles. The thick line corresponds to the lost likely log g. The right panels show histograms of the log g values associated with all the pixels within the shaded windows. The most probable log g and its error are obtained by bootstrapping.
Current usage metrics show cumulative count of Article Views (full-text article views including HTML views, PDF and ePub downloads, according to the available data) and Abstracts Views on Vision4Press platform.
Data correspond to usage on the plateform after 2015. The current usage metrics is available 48-96 hours after online publication and is updated daily on week days.
Initial download of the metrics may take a while.