Fig. A.1
Download original image
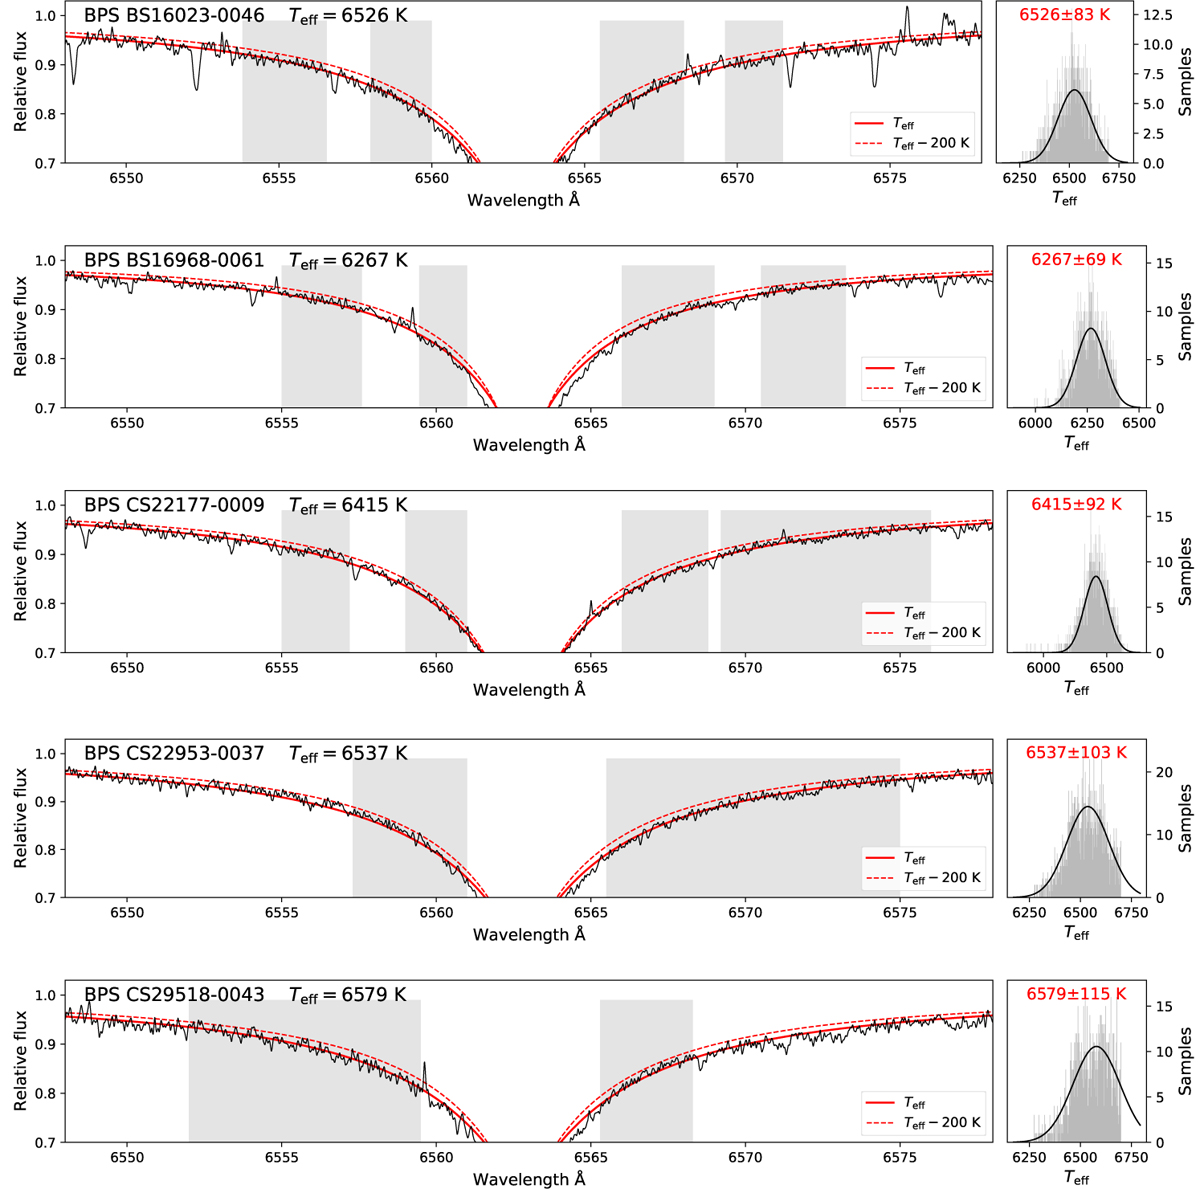
Hα profile fits of five dwarf stars from Meléndez et al. (2010). In the left panels the observational spectra are shown in black. The fitted 3D NLTE synthetic Hα line profile is represented by the red continuous line, and a synthetic profile related to a Teff −200 K is represented by the dashed red line. Shades represent the windows of fits employed. The right panels show histograms of the temperature values related every pixel within the windows of the fits. The histograms are fitted by Gaussian distributions (black lines), whose medians and 1σ dispersions, are the most likely Teff values and their corresponding errors.
Current usage metrics show cumulative count of Article Views (full-text article views including HTML views, PDF and ePub downloads, according to the available data) and Abstracts Views on Vision4Press platform.
Data correspond to usage on the plateform after 2015. The current usage metrics is available 48-96 hours after online publication and is updated daily on week days.
Initial download of the metrics may take a while.