Fig. 10
Download original image
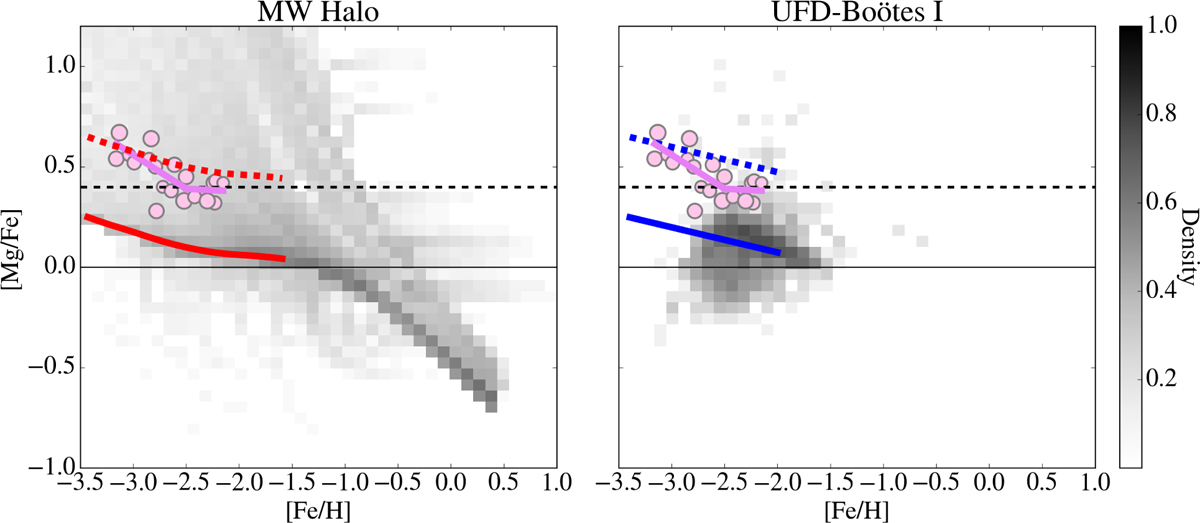
Predicted [Mg/Fe] versus [Fe/H] density maps. Left panel: chemical evolution model for the Milky Way. Right panel: chemical evolution model for UFD galaxy Boötes I, taken as a prototype of the satellites accreted by the MW at early times. The highest density region of the GCE model and the average of UDF model are offset by +0.4 dex (dotted red line and dotted blue line, respectively) to allow a better comparison with the observed abundances. The pink solid line is the LOWESS regression. The circles represent the Precision I sample with Mg under 3D NLTE.
Current usage metrics show cumulative count of Article Views (full-text article views including HTML views, PDF and ePub downloads, according to the available data) and Abstracts Views on Vision4Press platform.
Data correspond to usage on the plateform after 2015. The current usage metrics is available 48-96 hours after online publication and is updated daily on week days.
Initial download of the metrics may take a while.