Open Access
Fig. 7
Download original image
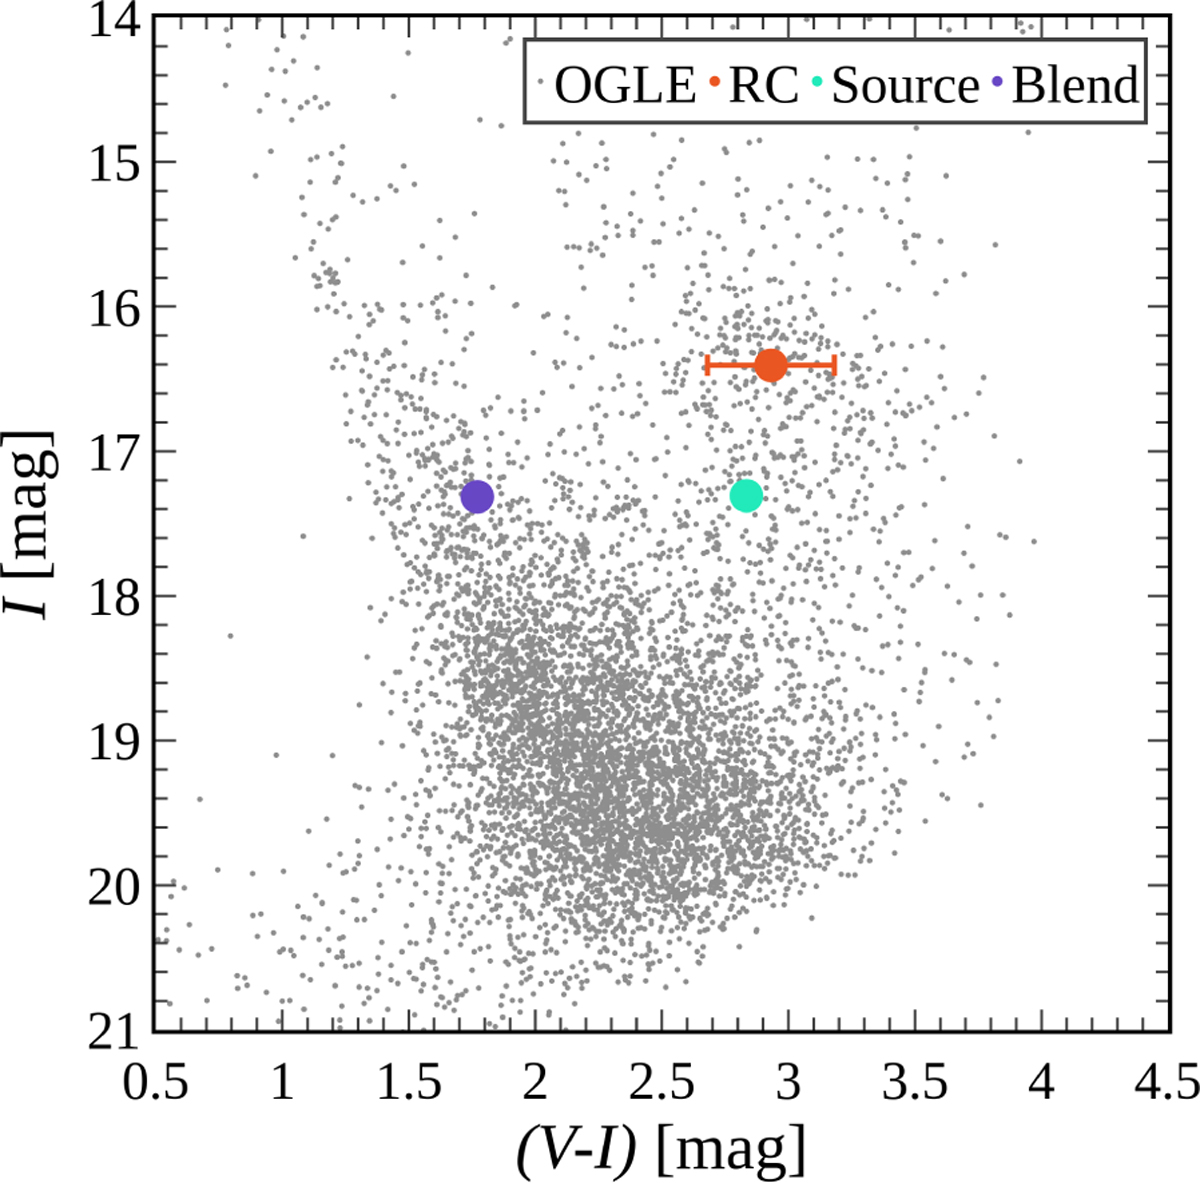
Color–magnitude diagram for stars in the OGLE-IV data within 2′ of the microlensed star in the OGLE-2015-BLG-1609 event. The red circle marks the position of the RC centroid, while the turquoise and purple circles mark the positions of the source and blend, respectively.
Current usage metrics show cumulative count of Article Views (full-text article views including HTML views, PDF and ePub downloads, according to the available data) and Abstracts Views on Vision4Press platform.
Data correspond to usage on the plateform after 2015. The current usage metrics is available 48-96 hours after online publication and is updated daily on week days.
Initial download of the metrics may take a while.