Fig. 3
Download original image
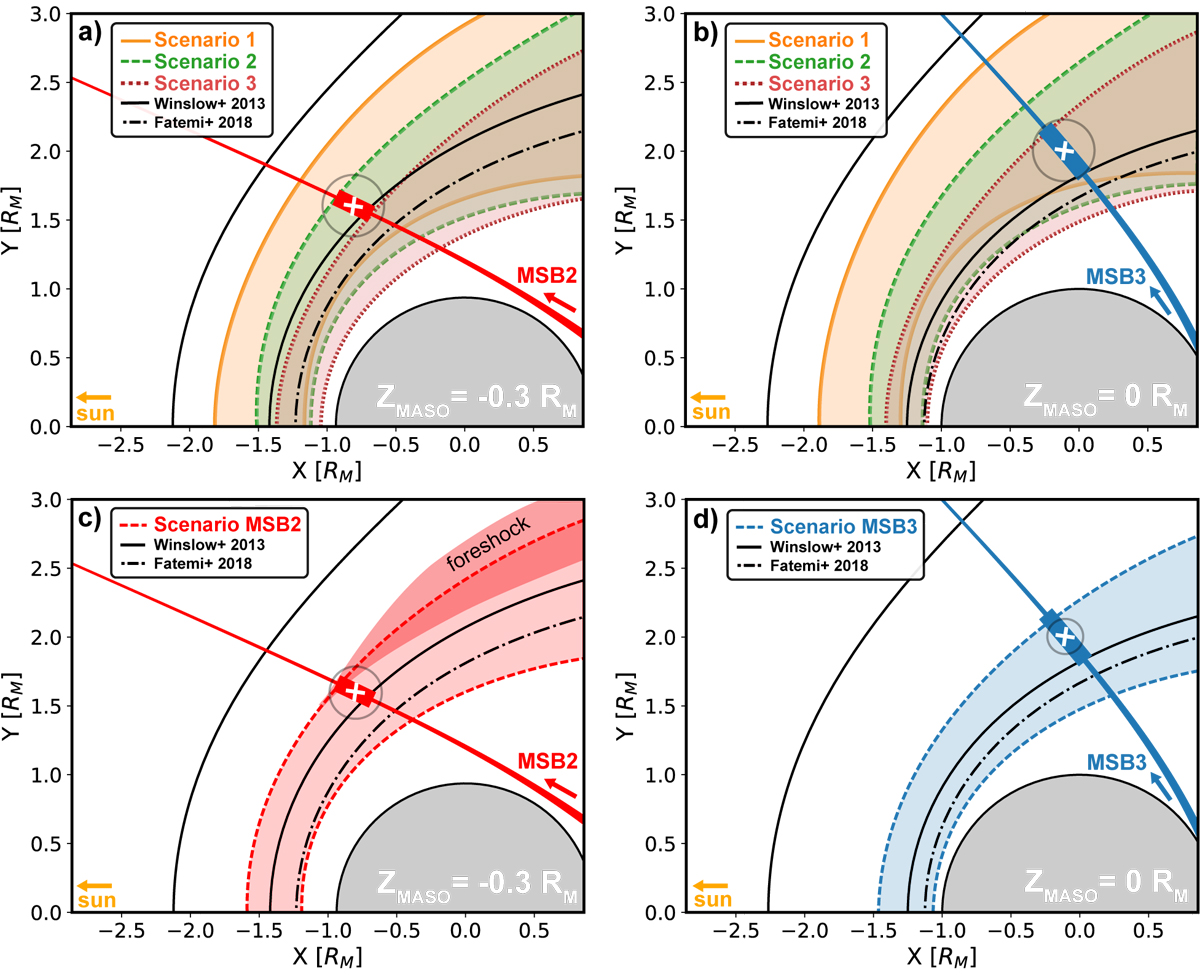
BepiColombo MSB2 and MSB3 trajectories and target magnetosheath intervals in the xy-plane (MASO) at the mean Z locations during the target intervals (ZMASO = −0.3 RM for MSB2 and ZMASO = 0 RM for MSB3). All panels show the BepiColombo swingby trajectory as solid lines in red (MSB2) or blue (MSB3), and the linewidth indicates the Z component (the line gets thinner as the spacecraft moves southbound). The target intervals and center point along the trajectories are denoted with rectangles and white crosses (PICAM time frames are 2022-06-23 09:52–09:53 UTC for MSB2 and 2023-06-19 19:48–19:51 UTC for MSB3). The gray circles, centered on the white crosses, represent the typical propagation distance of a solar wind proton within 1 second: 550 km (panels a, b), 450 km (panel c), and 330 km (panel d). Moreover, the solid black lines in all panels denote the average bow shock and magnetopause boundaries from Winslow et al. (2013) with varying fit parameters, as described in the text. The dash-dotted line shows the magnetopause in another hybrid model study by Fatemi et al. (2018). Panels a and b show shaded areas representing the magnetosheath in the S1, S2, and S3 scenarios. Panels c and d show the magnetosheath in the MSB2 and MSB3 scenarios as red and blue shaded areas, respectively.
Current usage metrics show cumulative count of Article Views (full-text article views including HTML views, PDF and ePub downloads, according to the available data) and Abstracts Views on Vision4Press platform.
Data correspond to usage on the plateform after 2015. The current usage metrics is available 48-96 hours after online publication and is updated daily on week days.
Initial download of the metrics may take a while.