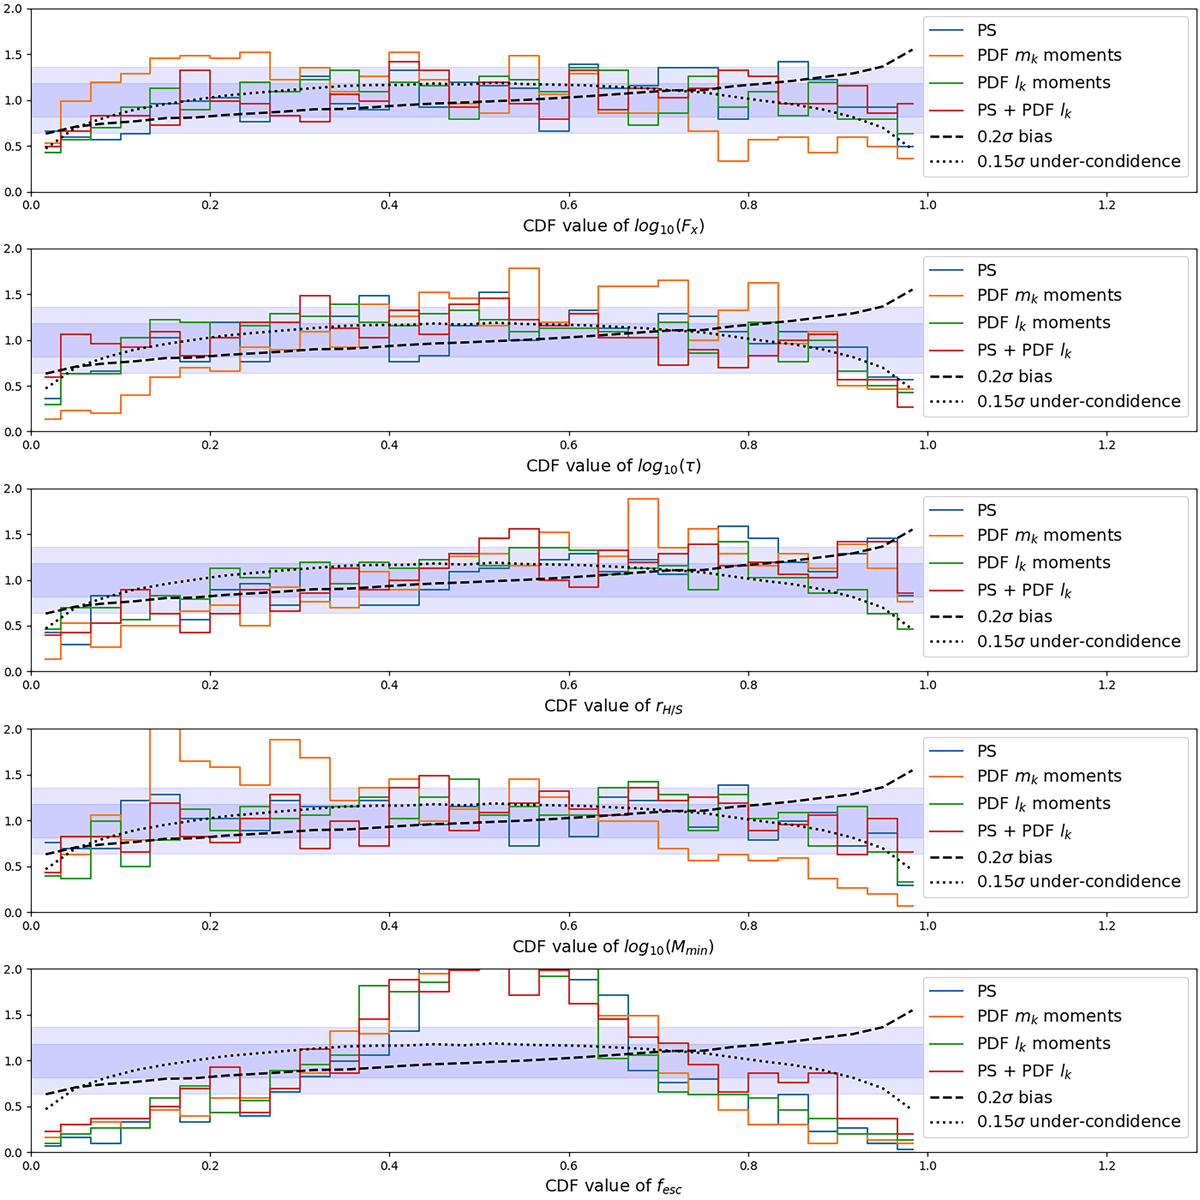
Fig. 3.
Download original image
Histograms over the 908 inferences describing where the true parameter values fall in the cumulative distribution function of the 1D marginalised posteriors. One histogram is plotted for each different NDE. If the posteriors match the true unknown posteriors the histogram should be flat. A toy model is plotted for comparison where the approximate posterior is a biased or under-confident normal distribution and the true posterior is the normal distribution.
Current usage metrics show cumulative count of Article Views (full-text article views including HTML views, PDF and ePub downloads, according to the available data) and Abstracts Views on Vision4Press platform.
Data correspond to usage on the plateform after 2015. The current usage metrics is available 48-96 hours after online publication and is updated daily on week days.
Initial download of the metrics may take a while.