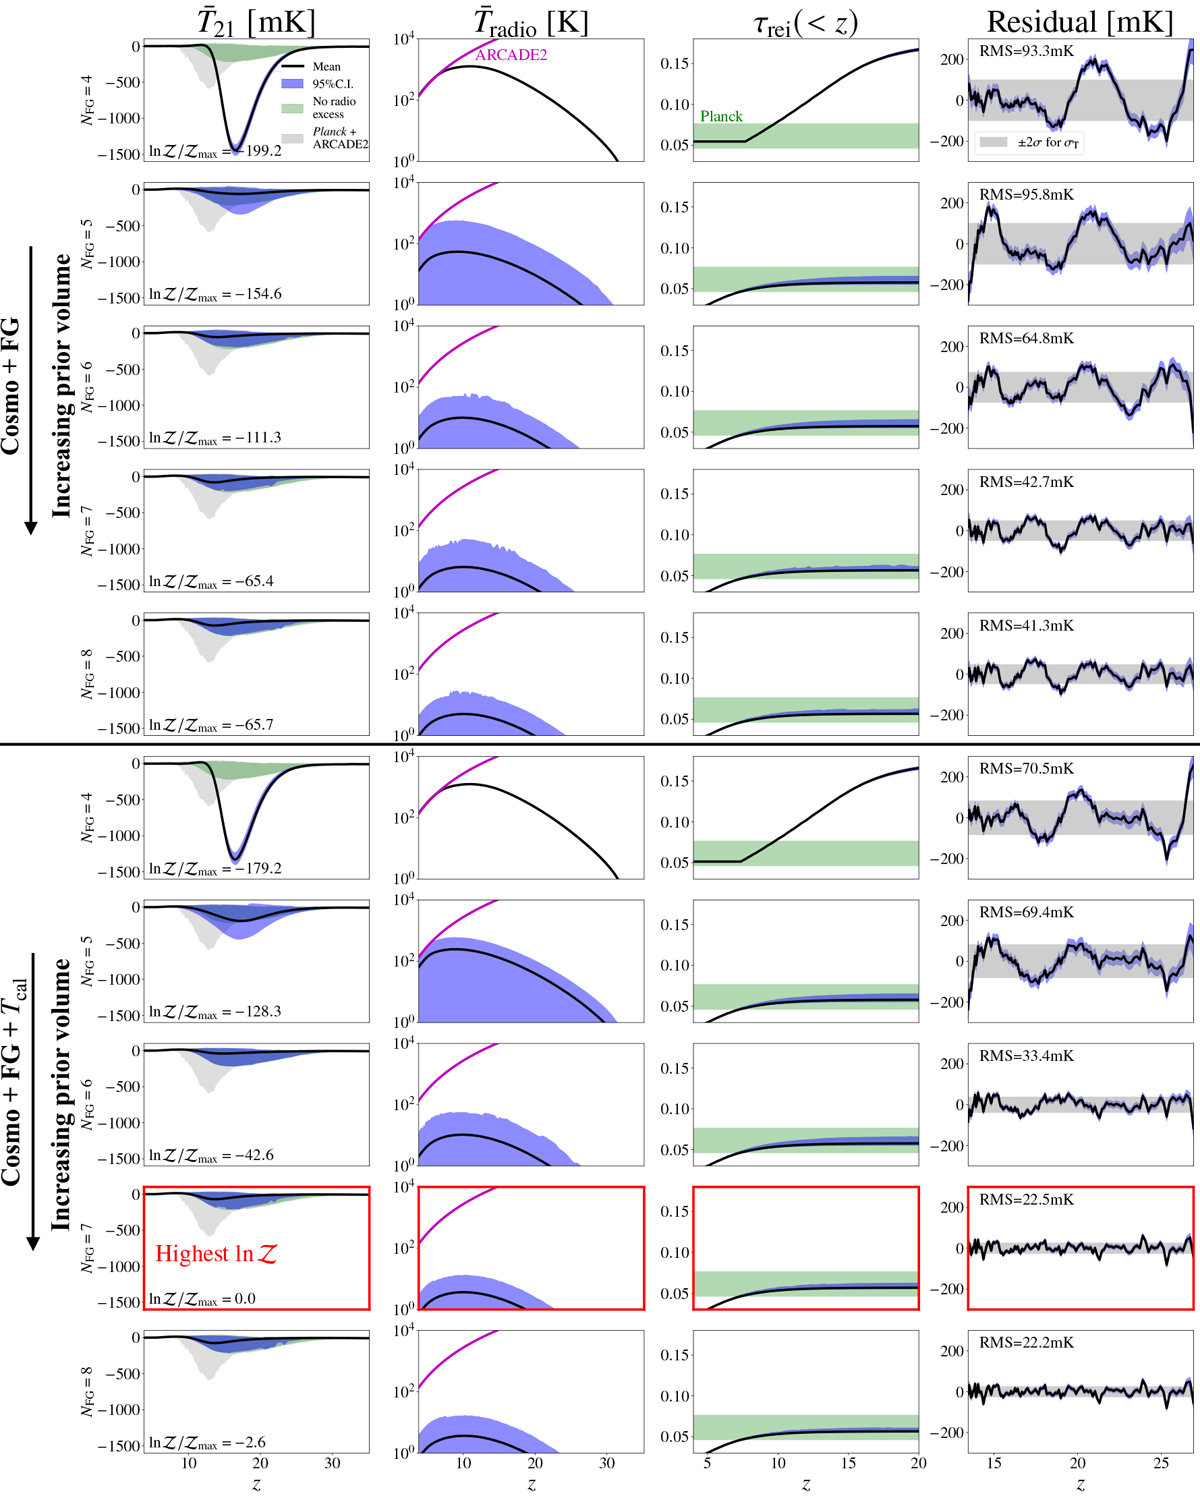
Fig. 6.
Download original image
Marginalised posteriors from a subset of our inferences. From left to right, we show results for ![]() ,
, ![]() , cumulative optical depth τrei(z), residual (
, cumulative optical depth τrei(z), residual (![]() ), respectively. Each row corresponds to a different model, with the general trend of increasing systematics prior volume with decreasing row. The number of FG terms NFG is indicated in the y-axis in the
), respectively. Each row corresponds to a different model, with the general trend of increasing systematics prior volume with decreasing row. The number of FG terms NFG is indicated in the y-axis in the ![]() sub-panels. Black solid lines and blue shaded contours show mean and 95% C.I. regions, respectively. In the
sub-panels. Black solid lines and blue shaded contours show mean and 95% C.I. regions, respectively. In the ![]() sub-panels, the green contours indicate the 95% C.I. assuming no radio background excess (i.e., setting fR,III = 0 and only using the Planck likelihood), while the gray contours indicate the 95% C.I. using only ARCADE2 + Planck likelihoods (i.e., no EDGES). The green bar in the τrei(z) sub-panels denotes the 95% C.I. from Planck (Qin et al. 2020b) (see Eq. (31)). In the residual sub-panels, the ±2σ extent of the inferred Gaussian error σT is demarcated in gray.
sub-panels, the green contours indicate the 95% C.I. assuming no radio background excess (i.e., setting fR,III = 0 and only using the Planck likelihood), while the gray contours indicate the 95% C.I. using only ARCADE2 + Planck likelihoods (i.e., no EDGES). The green bar in the τrei(z) sub-panels denotes the 95% C.I. from Planck (Qin et al. 2020b) (see Eq. (31)). In the residual sub-panels, the ±2σ extent of the inferred Gaussian error σT is demarcated in gray.
Current usage metrics show cumulative count of Article Views (full-text article views including HTML views, PDF and ePub downloads, according to the available data) and Abstracts Views on Vision4Press platform.
Data correspond to usage on the plateform after 2015. The current usage metrics is available 48-96 hours after online publication and is updated daily on week days.
Initial download of the metrics may take a while.