Fig. 5.
Download original image
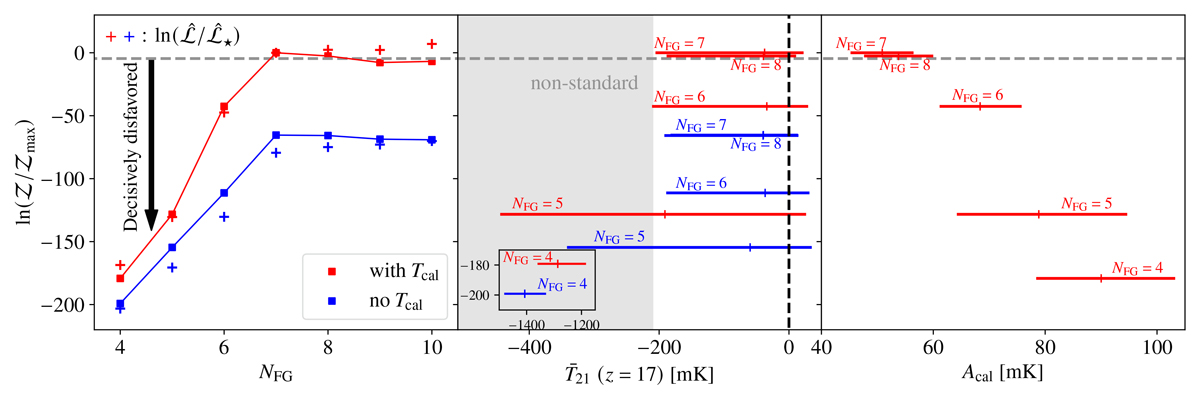
Bayesian log-evidence normalized to the highest evidence model, ![]() , as a function of FG flexibility NFG (squares in the left panel),
, as a function of FG flexibility NFG (squares in the left panel), ![]() at z = 17 (middle), and calibration amplitude Acal (right, defined as
at z = 17 (middle), and calibration amplitude Acal (right, defined as ![]() ). Models with NFG ≥ 9 are omitted in the middle and right panel for visibility, as they overlap with NFG = 8, 9. Models below the horizontal gray dashed line are decisively disfavored (
). Models with NFG ≥ 9 are omitted in the middle and right panel for visibility, as they overlap with NFG = 8, 9. Models below the horizontal gray dashed line are decisively disfavored (![]() ). We use red and blue colors to represent scenarios of no Tcal
and with Tcal
, respectively. The error bars in the middle and right panels represent 95% C.I. regions around the mean. In the middle panel, the region below the standard expectation (
). We use red and blue colors to represent scenarios of no Tcal
and with Tcal
, respectively. The error bars in the middle and right panels represent 95% C.I. regions around the mean. In the middle panel, the region below the standard expectation (![]() mK) is shaded in gray, while the vertical black dashed line indicates
mK) is shaded in gray, while the vertical black dashed line indicates ![]() . In the left panel, the blue and red crosses show the maximum log-likelihood ratio,
. In the left panel, the blue and red crosses show the maximum log-likelihood ratio, ![]() , normalized to our highest evidence model.
, normalized to our highest evidence model.
Current usage metrics show cumulative count of Article Views (full-text article views including HTML views, PDF and ePub downloads, according to the available data) and Abstracts Views on Vision4Press platform.
Data correspond to usage on the plateform after 2015. The current usage metrics is available 48-96 hours after online publication and is updated daily on week days.
Initial download of the metrics may take a while.