Fig. 4.
Download original image
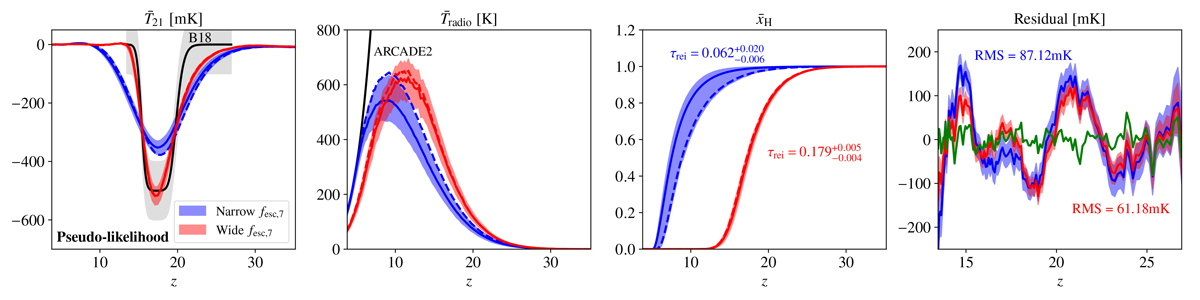
Results from our pseudo-likelihood inferences in which the likelihood is defined on the recovered flattened Gaussian from B18 instead of directly in the sky temperature space (see text for details). Our ARCADE2 and Planck likelihoods are also included in the analysis. From left to right, we show in red and blue the posteriors for ![]() ,
, ![]() ,
, ![]() and the residuals. Solid and dashed lines correspond to mean and MAP, respectively, and shaded contours indicate 95% C.I.s. Results in red use the astrophysical prior ranges listed in Table 1 and lead to an extremely early reionization. Those in blue adopt a narrow fesc,7 prior of [10−6, 10−2.5] to accommodate EoR timing constraints. In the
and the residuals. Solid and dashed lines correspond to mean and MAP, respectively, and shaded contours indicate 95% C.I.s. Results in red use the astrophysical prior ranges listed in Table 1 and lead to an extremely early reionization. Those in blue adopt a narrow fesc,7 prior of [10−6, 10−2.5] to accommodate EoR timing constraints. In the ![]() panel, we show B18 profile with black solid line and gray shaded region represents the uncertainty level adopted in our Pseudo-likelihood. The black solid line in the
panel, we show B18 profile with black solid line and gray shaded region represents the uncertainty level adopted in our Pseudo-likelihood. The black solid line in the ![]() panel shows the ARCADE2 excess. The 95% C.I. on τrei are indicated in the
panel shows the ARCADE2 excess. The 95% C.I. on τrei are indicated in the ![]() panel. For the residuals panel, we fit the EDGES data with a five term FG model while fixing the cosmic 21 cm signal to the corresponding MAP results in
panel. For the residuals panel, we fit the EDGES data with a five term FG model while fixing the cosmic 21 cm signal to the corresponding MAP results in ![]() panel. There is clear structure in the residuals. For comparison, we also include the residuals from our highest evidence model as a green line, which are noise-like.
panel. There is clear structure in the residuals. For comparison, we also include the residuals from our highest evidence model as a green line, which are noise-like.
Current usage metrics show cumulative count of Article Views (full-text article views including HTML views, PDF and ePub downloads, according to the available data) and Abstracts Views on Vision4Press platform.
Data correspond to usage on the plateform after 2015. The current usage metrics is available 48-96 hours after online publication and is updated daily on week days.
Initial download of the metrics may take a while.