Fig. 3.
Download original image
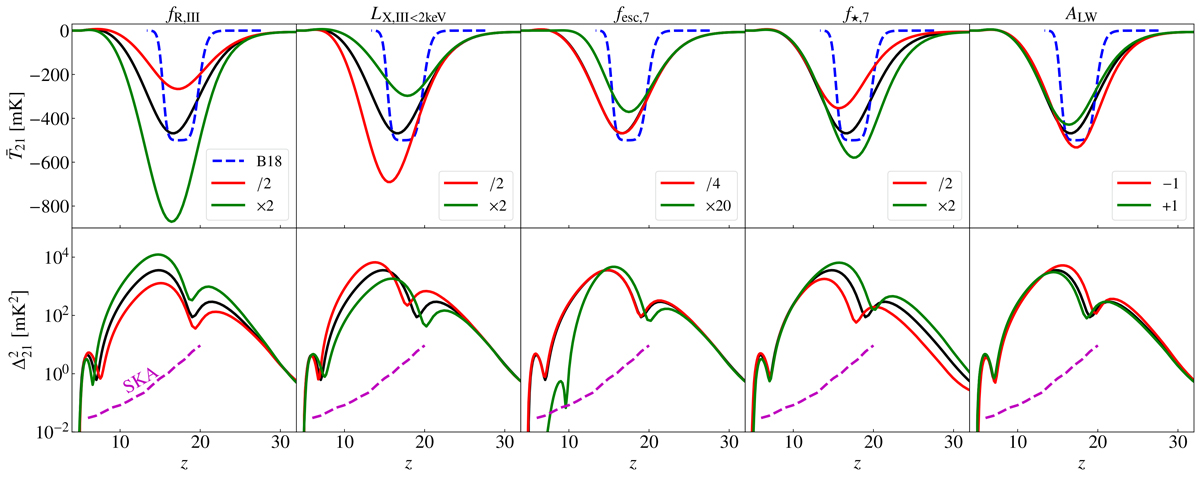
Effects of varying Pop III galaxy parameters on the 21 cm global signal (top) and power spectrum (bottom, at k = 0.1 Mpc−1). From left to right, we vary fR,III, LX,III < 2 kev, fesc,7, f⋆, 7 and ALW, respectively. The black solid lines correspond to the fiducial values used to compute Fig. 1, while the green (red) solid lines show the result from increasing (decreasing) each parameter while keeping the others fixed. The global 21 cm signal reported in B18 is shown in the top panels with blue dashed lines. In Δ212 panels the magenta dashed lines show the forecasted SKA sensitivity at k = 0.1 Mpc−1 (Barry et al. 2022).
Current usage metrics show cumulative count of Article Views (full-text article views including HTML views, PDF and ePub downloads, according to the available data) and Abstracts Views on Vision4Press platform.
Data correspond to usage on the plateform after 2015. The current usage metrics is available 48-96 hours after online publication and is updated daily on week days.
Initial download of the metrics may take a while.