Fig. 2.
Download original image
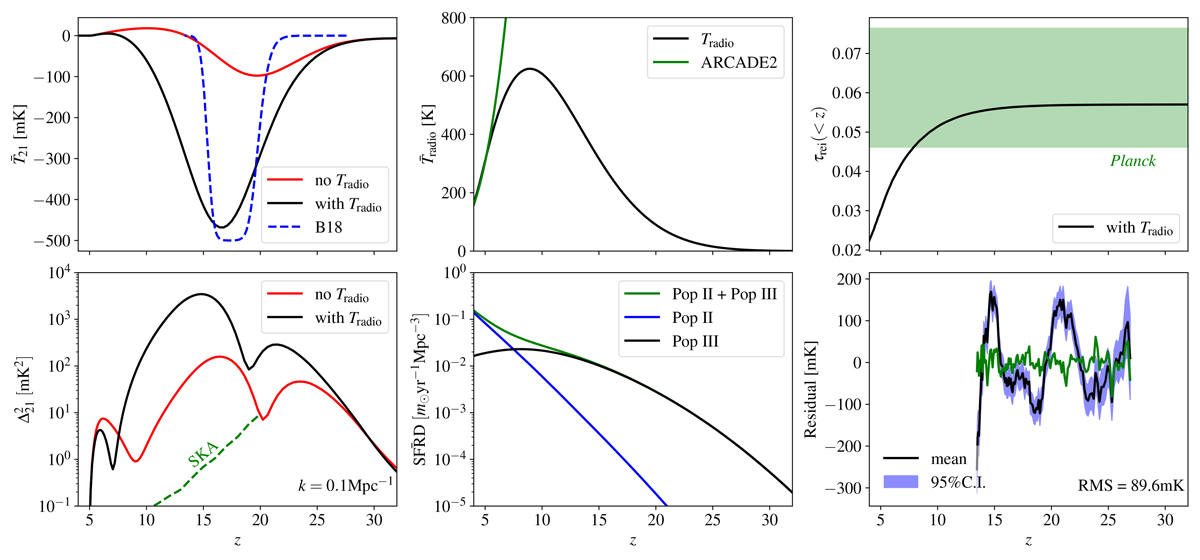
Summaries for the simulation shown in Fig. 1. In the top-left and middle panels, the black solid lines show global average values for T21 and Tradio, respectively. In the top-right panel, the black solid line shows the cumulative optical depth τrei(< z), which falls into the 95% C.I. region derived from Planck constraints in Eq. (31) (shown in green shaded contour). The blue dashed line in the ![]() panel shows the MAP flattened Gaussian profile recovered by B18, while the red curve corresponds to the same astrophysical model as shown with the black curve but without a radio background excess. The radio background observed by ARCADE2 (see Eqs. (26, 39)) is indicated in the
panel shows the MAP flattened Gaussian profile recovered by B18, while the red curve corresponds to the same astrophysical model as shown with the black curve but without a radio background excess. The radio background observed by ARCADE2 (see Eqs. (26, 39)) is indicated in the ![]() panel with the green solid line. The lower left panel shows the 21 cm power spectrum at k = 0.1 Mpc−1, with black and red solid lines corresponding to the cases with and without a radio excess, respectively, the green dashed line represents the projected SKA noise power at k = 0.1 Mpc−1 with a 1000 hour integration taken from Barry et al. (2022). We show the global star formation rate density in the lower middle panel, where the blue, black and green solid lines represent contributions from Pop II galaxies, Pop III galaxies and their sum, respectively. In the lower right panel, we present the brightness temperature residuals (mean and 95% C.I.) after performing inference on EDGES data with a five-term FG model and fixing the cosmic signal to the
panel with the green solid line. The lower left panel shows the 21 cm power spectrum at k = 0.1 Mpc−1, with black and red solid lines corresponding to the cases with and without a radio excess, respectively, the green dashed line represents the projected SKA noise power at k = 0.1 Mpc−1 with a 1000 hour integration taken from Barry et al. (2022). We show the global star formation rate density in the lower middle panel, where the blue, black and green solid lines represent contributions from Pop II galaxies, Pop III galaxies and their sum, respectively. In the lower right panel, we present the brightness temperature residuals (mean and 95% C.I.) after performing inference on EDGES data with a five-term FG model and fixing the cosmic signal to the ![]() profile shown with the black solid line in the top-left panel. There is an obvious, unaccounted for signal remaining in these residuals. For comparison, we also show in this panel the noise-like mean from our highest evidence model (green solid line; see Sect. 9 for details).
profile shown with the black solid line in the top-left panel. There is an obvious, unaccounted for signal remaining in these residuals. For comparison, we also show in this panel the noise-like mean from our highest evidence model (green solid line; see Sect. 9 for details).
Current usage metrics show cumulative count of Article Views (full-text article views including HTML views, PDF and ePub downloads, according to the available data) and Abstracts Views on Vision4Press platform.
Data correspond to usage on the plateform after 2015. The current usage metrics is available 48-96 hours after online publication and is updated daily on week days.
Initial download of the metrics may take a while.