Open Access
Fig. 9.
Download original image
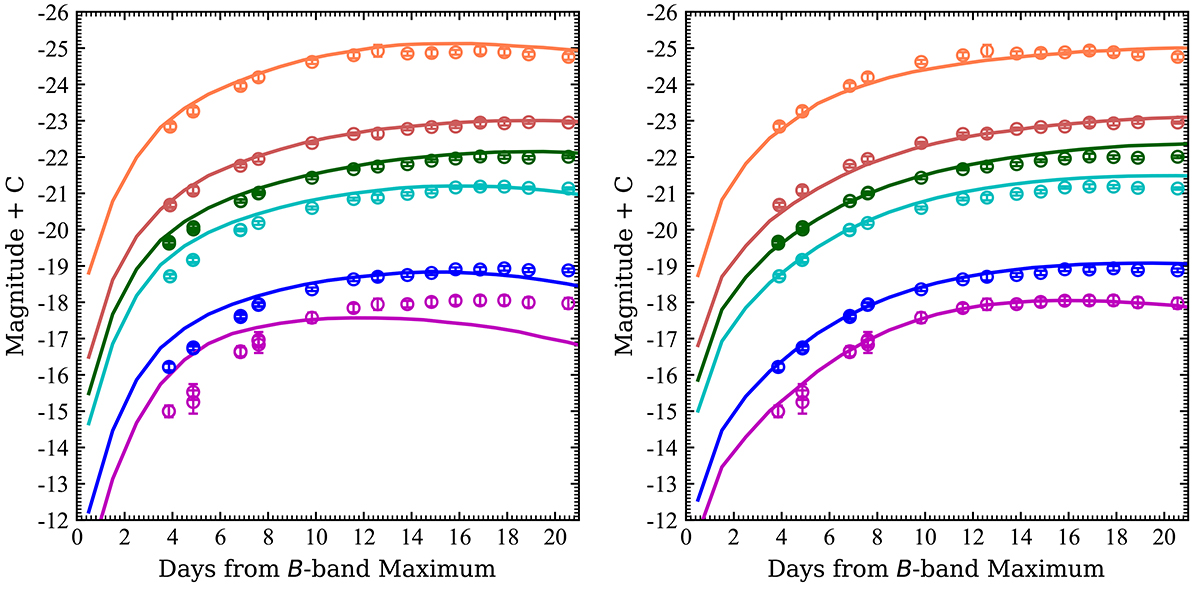
Comparison of the light curves of SN 2023xqm with the TURTLS models (Magee et al. 2020). The left panel shows the best-fitting model of DPL density profile of DPL_Ni0.4_KE1.68_P4.4. The right panel depicts the best-fitting model with EXP density profile of EXP_Ni0.6_KE0.78_P4.4.
Current usage metrics show cumulative count of Article Views (full-text article views including HTML views, PDF and ePub downloads, according to the available data) and Abstracts Views on Vision4Press platform.
Data correspond to usage on the plateform after 2015. The current usage metrics is available 48-96 hours after online publication and is updated daily on week days.
Initial download of the metrics may take a while.