Open Access
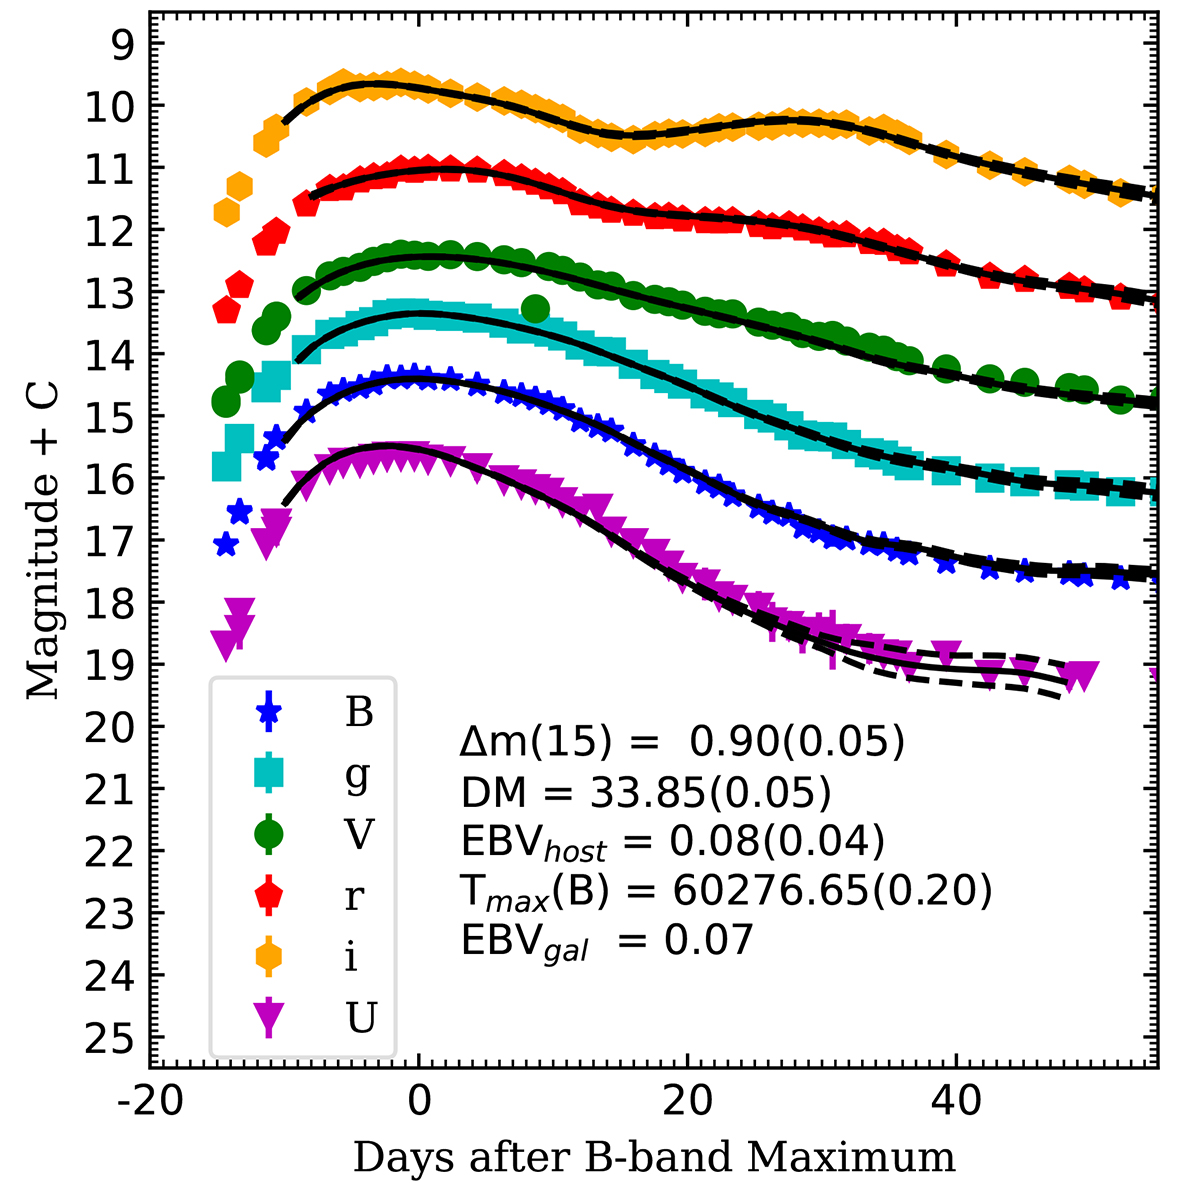
Fig. 4.
Download original image
Optimal light curve model for SN 2023xqm derived from SNooPy2 (solid black lines). The dashed black lines indicate the 1σ variability, which corresponds to the precision of the light curve patterns. The height of the curves has been adjusted to enhance visual distinction.
Current usage metrics show cumulative count of Article Views (full-text article views including HTML views, PDF and ePub downloads, according to the available data) and Abstracts Views on Vision4Press platform.
Data correspond to usage on the plateform after 2015. The current usage metrics is available 48-96 hours after online publication and is updated daily on week days.
Initial download of the metrics may take a while.