Fig. 15.
Download original image
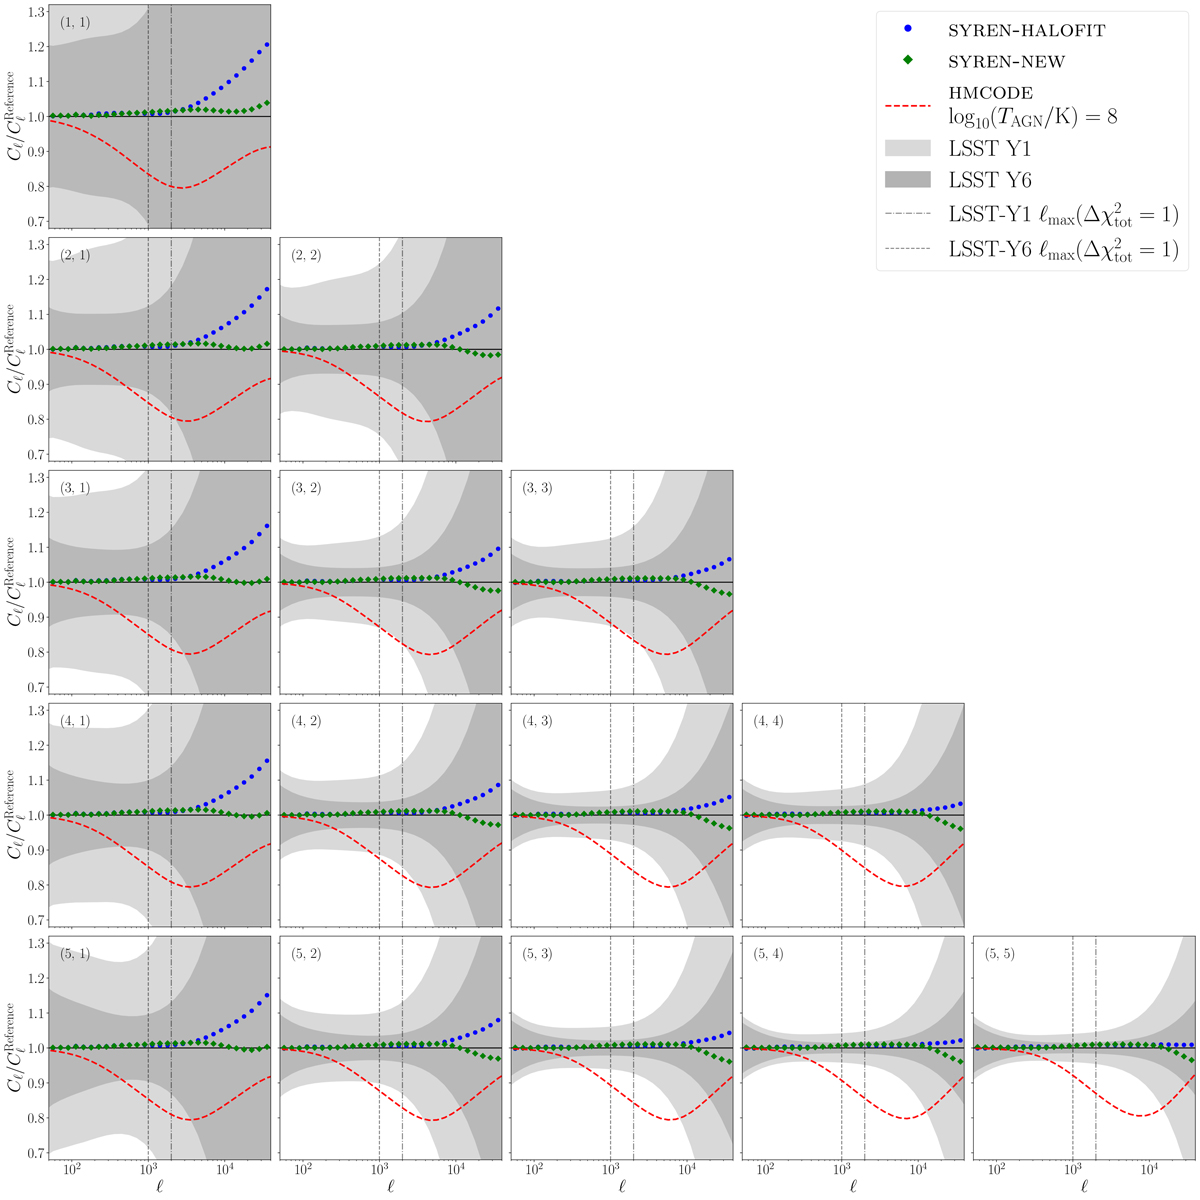
Ratio of shear power spectra, Cℓ (Eq. (35)), computed with SYREN-HALOFIT and SYREN-NEW compared to that computed with EUCLIDEMULATOR2 for LSST. The light gray bands indicate the expected uncertainty for year 1 (Y1), whereas the dark bands are for year 6 (Y6). The numbers in the top left of each panel indicate the redshift bins between which we compute the Cℓ's, such that the diagonal panels are auto-spectra and the off-diagonal ones are cross-spectra. To indicate the importance of baryonic effects, in red we plot the ratio of the HMCODE prediction in the presence of baryons (with log10(TAGN/K) = 8) to the dark-matter-only HMCODE prediction. With vertical lines, we show the scales for which the ![]() between our emulators and EUCLIDEMULATOR2 for full datavectorfor for both LSST Y1 and Y6. The discrepancy between the emulators is small compared to the LSST errors and especially compared to the impact of baryonic effects for the angular scales shown.
between our emulators and EUCLIDEMULATOR2 for full datavectorfor for both LSST Y1 and Y6. The discrepancy between the emulators is small compared to the LSST errors and especially compared to the impact of baryonic effects for the angular scales shown.
Current usage metrics show cumulative count of Article Views (full-text article views including HTML views, PDF and ePub downloads, according to the available data) and Abstracts Views on Vision4Press platform.
Data correspond to usage on the plateform after 2015. The current usage metrics is available 48-96 hours after online publication and is updated daily on week days.
Initial download of the metrics may take a while.