Fig. 14.
Download original image
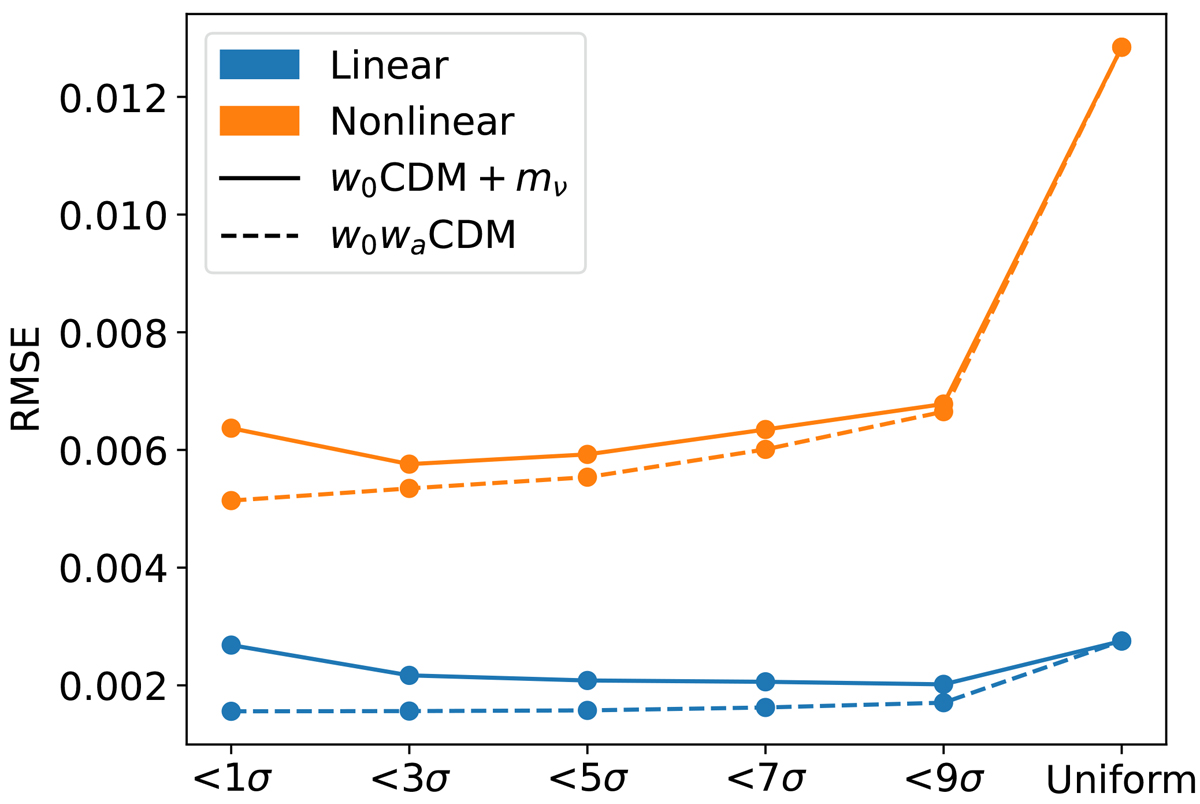
Distribution of errors of the linear (blue) and nonlinear (orange) emulator as a function of distance from the best-fit model in the w0waCDM subspace (dashed lines) and the w0CDM+mν subspace (solid lines). The x axis represents the maximum σ value used for generating the test set. The “Uniform” case corresponds to generating test samples by uniformly sample parameters in the whole prior range.
Current usage metrics show cumulative count of Article Views (full-text article views including HTML views, PDF and ePub downloads, according to the available data) and Abstracts Views on Vision4Press platform.
Data correspond to usage on the plateform after 2015. The current usage metrics is available 48-96 hours after online publication and is updated daily on week days.
Initial download of the metrics may take a while.