| Issue |
A&A
Volume 698, May 2025
|
|
|---|---|---|
| Article Number | A135 | |
| Number of page(s) | 9 | |
| Section | Extragalactic astronomy | |
| DOI | https://doi.org/10.1051/0004-6361/202452354 | |
| Published online | 11 June 2025 | |
Multiple flares and asymmetric broad emission lines in a recurring changing-look active galactic nucleus
1
National Astronomical Observatories, Chinese Academy of Sciences, 20A Datun Road, Chaoyang District, Beijing 100101, People's Republic of China
2
College of Physics and Information Engineering, Quanzhou Normal University, Quanzhou, Fujian 362000, People's Republic of China
3
Special Astrophysical Observatory, Russian Academy of Sciences, Nizhnii Arkhyz, Zelenchukskiy region, Karachai-Cherkessian Republic, 357147, Russia
4
Space Research Institute Russian Academy of Sciences, 84/32 Profsouznaya str., Moscow, 117997, Russian Federation
5
School of Mathematics, Statistics and Physics, Newcastle University, Newcastle upon Tyne, NE1 7RU, UK
6
Key Laboratory for Particle Astrophysics, Institute of High Energy Physics, Chinese Academy of Sciences, 19B Yuquan Road, Beijing 100049, People's Republic of China
7
Chinese Academy of Sciences South America Center for Astronomy, National Astronomical Observatories, CAS, Beijing 100101, People's Republic of China
8
School of Physics and Technology, Nanjing Normal University, No. 1, Wenyuan Road, Nanjing, 210023, People's Republic of China
9
Yunnan Observatories, Chinese Academy of Sciences, Kunming 650011, People's Republic of China
10
Key Laboratory for the Structure and Evolution of Celestial Objects, Chinese Academy of Sciences, Kunming 650011, People's Republic of China
11
Key Laboratory of Optical Astronomy, National Astronomical Observatories, Chinese Academy of Sciences, Beijing 100012, People's Republic of China
12
Kavli Institute for Astronomy and Astrophysics, Peking University, Beijing 100871, People's Republic of China
13
Department of Astronomy, School of Physics, Peking University, Beijing 100871, People's Republic of China
⋆ Corresponding authors: guowj@bao.ac.cn; zzx@qztc.edu.cn; zouhu@bao.ac.cn
Received:
24
September
2024
Accepted:
2
May
2025
We report a case of a changing-look (CL) active galactic nucleus (AGN) at a redshift of z=0.337, identified as J075947.73+112507.3 (hereafter J0759), which exhibits recurring changing-look (RCL) phenomena accompanied by extreme asymmetry in the broad emission-line profiles. J0759 was discovered through the CL-AGN project conducted with the Dark Energy Spectroscopic Instrument. The most recent CL event was confirmed with new spectroscopic observations obtained using the Big Telescope Alt-azimuthal. Variability trends observed in the optical and mid-infrared light curves reveal multiple flares, indicating four to six potential CL events over time. We decomposed the asymmetric broad Hα emission line into two components, which persist in both high and low states. The RCL events in J0759 are inconsistent with the obscuration model and are more likely driven by variations in the accretion rate. However, the physical mechanism underlying such rapid accretion-rate changes remains unclear.
Key words: galaxies: active / galaxies: nuclei / quasars: supermassive black holes
© The Authors 2025
 Open Access article, published by EDP Sciences, under the terms of the Creative Commons Attribution License (https://creativecommons.org/licenses/by/4.0), which permits unrestricted use, distribution, and reproduction in any medium, provided the original work is properly cited.
This article is published in open access under the Subscribe to Open model. Subscribe to A&A to support open access publication.
1. Introduction
Active galactic nuclei (AGNs) are fuelled by the accretion of matter onto supermassive black holes (SMBHs), which typically range from millions to billions of solar masses (Rees 1984; Ho 2008; Alexander & Hickox 2012). The surrounding gas and dust form an accretion disc that powers the AGN system, enabling it to emit radiation across the electromagnetic spectrum, from radio to X-ray bands (Antonucci 1993; Vaughan et al. 2003). During the accretion process, thermal instabilities in the accretion disc are one possible mechanism that can cause AGNs to become incredibly bright and highly variable, with luminosity changes occurring on timescales ranging from hours to years (Giveon et al. 1999; Lu et al. 2019), resulting in a strong anti-correlation between the wavelength and the timescale of variability.
Changing-look (CL) AGNs, one of the most striking examples of variability, can switch between different spectral types ranging from Type 1.0/1.2/1.5 to Type 1.8/1.9/2.0 (Khachikian & Weedman 1971; Osterbrock 1981), even transitioning from AGNs to normal galaxies (Shappee et al. 2014; Denney et al. 2014). For example, in the optical band, a CL-AGN might transition from a Type 1 AGN, characterised by broad emission lines, to a Type 2 AGN, where the broad emission lines are absent, or vice versa. This rapid CL transition is inconsistent with the traditional AGN unification model (Ricci & Trakhtenbrot 2023; Guo et al. 2024). Moreover, CL transitions can occur on extremely short timescales, sometimes within just a few months or years, which is inconsistent with the expected viscous timescale for changes in the accretion disc state (∼104 years). This discrepancy further challenges our understanding of the stability of accretion systems, although shorter thermal timescales may also play a role (Graham et al. 2020; Li et al. 2022; Zeltyn et al. 2022).
The study of CL-AGNs is crucial for unravelling the physical accretion processes around SMBHs and the AGN duty cycle. However, the physical mechanisms behind CL transitions are still poorly understood (Yang et al. 2018; MacLeod et al. 2016; Green et al. 2022). These phenomena are believed to be driven by various factors, including fluctuations in the accretion rate of the black hole, changes in the state or orientation of the accretion disc, tidal disruption events, and the presence or absence of obscuring material along our line of sight (see the review by Ricci & Trakhtenbrot 2023 for further details).
Recently, exceptional cases of AGNs undergoing recurring changing-look (RCL) events have been reported (Husemann et al. 2016; Mathur et al. 2018; Zeltyn et al. 2022; Wang et al. 2024). Analysing the phenomenon of RCL-AGNs offers valuable insights into the physical mechanisms driving CL events. For example, in the case of Mrk 590, two CL events were reported over timescales of roughly a decade, which have been widely attributed to changes in the accretion rate, as suggested by Denney et al. (2014) and Mathur et al. (2018). Additionally, Zeltyn et al. (2022) report a case where two CL events occurred within two years. More recently, Wang et al. (2024) documented 11 objects with transition timescales ranging from several years to decades.
Guo et al. (2025) have provided several RCL-AGN candidates whose light curves have ‘V-shaped’ or ‘reverse V-shaped’ patterns (see Fig. 11 in Guo et al. 2025), with an average transition timescale of over two years. Based on a strong correlation between the variability of the continuum flux and the emission line flux in over 500 CL-AGNs in Guo et al. (2025), it is expected that if the photometric light curve of a CL-AGN in a turn-off state reaches the same flux level as that of its high-state spectrum, another CL event is likely to occur. Once such a CL-AGN is identified, our approach will aid in discovering and classifying RCL-AGNs, primarily through follow-up spectral monitoring of known CL-AGNs.
In this paper we present a unique AGN discovered with the Dark Energy Spectroscopic Instrument (DESI) and the Sloan Digital Sky Survey (SDSS), J075947.73+112507.3 (hereafter J0759), which has gone through multiple CL transitions. J0759 is also particularly noteworthy due to its asymmetric broad emission-line profile. Section 2 describes the spectral and photometric data. Section 3 analyses the multiple outbursts, broad emission profile, and multi-wavelength properties. We discuss several possible physical interpretations for J0759 in Sect. 4. A summary is provided in Sect. 5. Throughout the study, we adopt a Λ cold dark matter cosmology with H0=67 km s−1 Mpc−1, ΩΛ=0.68, and Ωm=0.32, as reported by Planck Collaboration VI (2020), which is consistent within 2σ with the first cosmological results from DESI.
2. Data and processing
2.1. Optical data
2.1.1. Spectra
The spectral data for J0759 come from the DESI First Data Release and the SDSS Data Release 16 catalogues (Lyke et al. 2020). The DESI fibre size is 1.5″ in optical diameter, the spectral coverage is 3600∼9800 Å, and the spectral resolution is λ/Δλ≈3000 (Levi et al. 2013). The SDSS fibre size is 3″ in optical diameter in SDSS-I and SDSS-II, with a spectral coverage of 3800∼9100 Å, and a resolution of approximately λ/Δλ≈1000 (York et al. 2000). The spectra for J0759 were observed on 28 February 2006 (MJD = 53794) by SDSS and on 27 January 2022 (MJD = 59606) by DESI. These spectra are displayed in the top panel of Fig. 1, with the SDSS spectrum shown in black and the DESI spectrum in red. In the high-state DESI spectrum, the blue wings of all the Balmer emission line regions exhibit a significant peak.
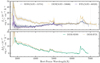 |
Fig. 1. Three optical spectra for J0759. Top panel: Smoothed spectra from SDSS (28 February 2006), DESI (27 January 2022), and BTA (10 January 2024) in orange, blue, and purple, respectively. Bottom panel: Differential spectra, with SDSS (BTA) and DESI represented by a green (brown) line. |
We performed a follow-up observation of J0759 using the 6.0m Big Telescope Alt-azimuthal (BTA) at the Special Astrophysical Observatory of the Russian Academy of Sciences (SAO RAS). The BTA spectrum was obtained using the SCORPIO-2 focal reducer in long-slit mode with an exposure time of 2400 s (Afanasiev & Moiseev 2011), a 1″ slit width, and a spectral resolution of λ/Δλ≈1000 over the spectral range 3600∼7300 Å. In the top panel of Fig. 1, the BTA spectrum obtained on 10 January 2024 (MJD = 60304) is shown in blue. Notably, the broad Hβ emission line has almost disappeared in this spectrum, consistent with the earlier SDSS spectrum.
We corrected the spectra for Galactic extinction using the extinction curve from Fitzpatrick (1999), assuming RV=3.1. The reddening for J0759 was set to E(B−V)=0.023 mag based on the Schlegel, Finkbeiner, and Davis (SFD) extinction map (Schlegel et al. 1998; Schlafly & Finkbeiner 2011). The spectra were subsequently shifted to the rest frame using a redshift of z=0.337, and the fluxes and associated uncertainties were re-binned onto a common wavelength grid (2 Å per pixel), which enabled the difference between the spectra of the three observations to be calculated. The differential spectra are displayed in the bottom panel of Fig. 1. The two differential spectra from DESI and SDSS/BTA exhibit similar asymmetric broad emission line profiles. For the BTA spectrum, we compared the Hγ and Hβ lines as Hα lies outside its wavelength range. We acknowledge a small difference (∼2.7%) in the [O iii] λ5007 flux between the SDSS and DESI spectra. However, due to differences in fibre aperture sizes and observing conditions between the two instruments, we chose not to apply [O iii]-based flux scaling. Such a correction could introduce additional uncertainties rather than reduce them. We therefore proceeded without rescaling the spectra, while remaining cautious in interpreting any derived quantities that depend on absolute flux calibration.
We used DASpec1 to perform a multi-component decomposition of the DESI and SDSS spectra2 (Du 2024), as shown in Fig. 2. The fitting components include a power-law AGN continuum, a galaxy template from Bruzual & Charlot (2003), a Fe ii pseudo-continuum template from Boroson & Green (1992), a Balmer pseudo-continuum, and single Gaussians for narrow emission lines ([O ii] λ3727, Hδ λ4102, Hγ λ4340, Hβ λ4861, [O iii] λλ4959, 5007, [N ii] λ6548, Hα λ6563, [N ii] λ6583, and [S ii] λλ6716, 6731). We adopted three Gaussians to model the profiles of the Hα λ6563, Hβ λ4861, Hγ λ4340, and Hδ λ4102 broad emission lines; they are based on the observed line shapes that exhibit multiple peaks and asymmetries and are not well represented by single or double Gaussian components. The number of Gaussians was determined through iterative fitting, selecting the model that minimised the reduced chi-square value and produced the best residuals. The full width at half maximum (FWHM) and velocity shift of the various broad Balmer components and narrow emission lines were tied together. The host galaxy model, with an age of 11 Gyr and metallicity Z⊙=0.08, yielded the lowest χ2 value, based on templates from Bruzual & Charlot (2003).
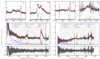 |
Fig. 2. Spectral decomposition results (middle) and fitting residuals (bottom) for DESI (left) and SDSS (right). The top panels are a zoom-in decomposition of the Hβ and Hα regions. Shown are: the observed spectral data (black line), the best-fit model (red), the power-law continuum (purple), the host galaxy template (violet), the Fe ii pseudo-continuum template (pink), the Balmer continuum (teal), the narrow components (grey), the blue wing components (BWC; blue), and the main core components (MCC; yellow). The grey-shaded region marks the fitting window (3040 Å to 7200 Å). |
2.1.2. Photometry
We compiled long-term light curves to analyse the variability of J0759, including the Catalina Real-time Transient Survey (CRTS; V band; Drake et al. 2009), Pan-STARRS1 (PS1; g and r bands; Chambers et al. 2016), and the Zwicky Transient Facility (ZTF; g and r band; Masci et al. 2019). Due to differences in observed bands, flux zero-points, and calibration methods across the three surveys, a direct comparison of the original light curves was not feasible. To overcome this, we first calibrated the PS1 data to the ZTF photometric scale using the magnitude conversion relationships in the g and r bands provided by Medford et al. (2020). Next, we scaled the CRTS V-band data to match the PS1 r band using the Bayesian package PyCALI3 (Li et al. 2014). Due to the lack of overlapping light curve comparisons between ZTF and PS1, we were unable to perform calibration using PyCALI. According to Medford et al. (2020), during the transformation process, the discrepancies between ZTF magnitudes derived from PS1 transformations and the actual ZTF magnitudes for non-variable stars are 0.114 mag in the g band and 0.063 mag in the r band. Consequently, it is important to acknowledge that some uncertainties may persist in the calibrated PS1 data compared to the ZTF data.
The optical light curves for the g and r bands are displayed in the middle and bottom panels of Fig. 4. Additionally, following the method outlined by Guo et al. (2024), we convolved the SDSS, DESI, and BTA spectra with the ZTF g- and r-bandpass filters to obtain pseudo-photometric magnitudes, as shown in the middle and bottom panels of Fig. 4. J0759 exhibits undetectable variability in the CRTS and PS1 light curves, as the amplitude of the variability remains below the statistical uncertainty threshold: σ2≤Δ2 (Eq. (4) in Guo et al. 2022), where σ represents the intrinsic variability of the light curve and Δ denotes the measurement uncertainty. In comparison with the low-luminosity state observed in the period covered by CRTS and PS1, the ZTF data show two significant flares in both the g and r bands.
2.2. Mid-infrared data
We collected mid-infrared light curves from the Near-Earth Object Wide-field Infrared Survey Explorer (NEOWISE) for our analysis (Mainzer et al. 2014). NEOWISE has monitored the sky in the W1 and W2 bands since 2014, conducting routine observations every six months. Following Chen et al. (2023), we extracted 17 binned data points with a half-year sampling interval from 2014 to 2023 to compare the long-term variability in the W1 (3.4 μm) and W2 (4.6 μm) bands with the g and r bands. The top panel of Fig. 4 shows the NEOWISE light curves. The NEOWISE light curves also reveal multiple flares and a time delay relative to the optical light curves.
To explore the geometric structure and thermal properties of the dust torus, we measured the time delay between the optical (g band) and mid-infrared bands using the Multiple and Inhomogeneous Component Analysis (MICA4; Li et al. 2016), which recovers the light curve by assuming the AGN variability follows a damped random walk process and models the time lag among different light curves using a Gaussian function. Figure 5 presents the posterior distribution of the time delays obtained through the Markov chain Monte Carlo method, the transfer function, and the reconstructed light curves for the g, W1, and W2 bands. We discuss the results in Sect. 3.3.
2.3. Radio data
We utilised data from the Very Large Array Sky Survey (VLASS) and the Faint Images of the Radio Sky at Twenty cm (FIRST) survey. VLASS is a wide-area (33 885 deg2), high-resolution (2.5″) radio survey conducted in the S band (2–4 GHz) by the National Radio Astronomy Observatory, covering three epochs with a 32-month cadence and achieving a sensitivity of 0.12 mJy/beam (Gordon et al. 2021). For J0759, VLASS provided two epochs of observations with flux measurements of F3GHz=7.01±0.16 mJy at MJD = 58083 and F3GHz=6.36±0.21 mJy at MJD = 59049.
The FIRST survey, operating at 1.4 GHz, covers 10,575 deg2 with 5″ resolution and detects sources down to 1 mJy; it is 95% complete to 2 mJy (Becker et al. 1995). We collected the radio flux measurement of F1.4GHz=5.84±0.14 mJy from the Final Catalogue (Helfand et al. 2015), observed on 01 June 2000 (MJD = 51549). To convert the flux from 1.4 GHz to 3 GHz, we adopted a radio spectral index of α=−0.71 (Gordon et al. 2021). The final 3 GHz flux extrapolated from the FIRST survey is F3GHz=10.03±0.24 mJy.
3. Results
3.1. Multiple flares
In the middle and bottom panels of Fig. 4, two flares are visible in the ZTF g- and r-band light curves. The SDSS pseudo-photometric magnitude (dashed black line) is consistent with the light curves around MJD = 58 000 and MJD = 60 000, as well as with the pseudo-photometric magnitude of the BTA spectrum. The overall consistency between the BTA and SDSS spectra, particularly in the broad Hβ emission line, indicates that the flux variation of broad emission lines depends on the continuum variation, as previously demonstrated by the statistical correlation between continuum and emission line changes in Guo et al. (2025).
The dotted red line in Fig. 4 shows the pseudo-photometric magnitude from the DESI spectrum, which was captured after the decline of the second flare. The pseudo-photometric magnitude of the DESI spectrum is nearly identical to the brightness of the previous flare around MJD = 58700. Based on the statistical correlation between continuum and emission line changes observed in the CL-AGN sample from Guo et al. (2025), we would expect the broad Hβ emission line to have reappeared around this time. However, without an available spectrum around MJD = 58700, this cannot be confirmed. Considering the two flares in the ZTF light curve, we suspect that J0759 may have undergone multiple CL events, potentially up to four, over the five years of ZTF monitoring.
The mid-infrared light curve, in the top panel of Fig. 4, exhibited a delayed response to the two ZTF flares during the monitoring period, with a noticeable time lag (see details in Sect. 3.3). As shown in the reconstructed light curve (right panel of Fig. 5), if we extrapolate from the mid-infrared light curve beyond the start of the optical light curve, it is possible that there was a less luminous flare before the ZTF observations began.
The potential flare might also be associated with additional spectral changes, but given the limited spectroscopic coverage, we can only confirm two transitions. The data do not provide constraints on the timescale of broad-line appearance, and it remains uncertain whether CL ‘turn-on’ and CL ‘turn-off’ events occur on the same timescale. The RCL events in J0759, along with the observed photometric variability, suggest episodic changes in the accretion rate or obscuration as possible drivers of the spectral transitions. Future light curves and follow-up spectroscopy at different brightness states would be valuable for identifying and characterising any additional CL events.
3.2. Asymmetric profile
In Fig. 1, the DESI spectrum in the bright state reveals remarkably asymmetric broad emission line profiles for both Hα and Hβ, with a prominent peak in the blue wings. In contrast, in the dim-state SDSS spectrum, the Hβ line disappears or is diluted by spectral noise, and the asymmetry in the Hα line undergoes a significant change.
We performed a multi-component decomposition to explore these profile changes, as shown in Fig. 2. We primarily focused on Hα below since it is the only broad Balmer emission line detected in the SDSS spectrum. However, we note that the Hβ line in the bright-state DESI spectrum exhibits a similar asymmetric profile to Hα, which supports the association of the broad-line components with physical or kinematic structures in the broad-line region (BLR). While it would be interesting to compare this with the Mg ii λ λ 2795, 2803 line, the spectral coverage limits our ability to quantify it. However, as shown in Fig. 3, the velocity profiles of broad Mg ii, Hβ, and Hα all exhibit a similar asymmetry, suggesting a common origin for these asymmetric profiles, despite differences in their excitation mechanisms.
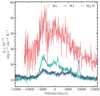 |
Fig. 3. Velocity space of broad Mg ii (red), Hβ (jasper), and Hα (green) from DESI spectra. |
For the DESI spectrum, we used a two-component model to account for the asymmetry. The blue wing component (BWC) was fitted with a single Gaussian, while the main core component (MCC) was modelled with a double Gaussian. The BWC exhibits a velocity shift of −4412±37 km/s, indicating a pronounced blueshift. The MCC shows a much smaller shift of −1332±328 km/s, suggesting that the BWC and MCC are likely distinct kinematic components, possibly originating from different physical processes or regions.
In the SDSS spectrum, the MCC could no longer be well represented by a double Gaussian and was instead fitted with a single Gaussian. Both components exhibited a smaller shift for the BWC (−3958±221 km/s) and MCC (−906±297 km/s) compared to the bright state. For the SDSS spectrum, the fit improves from  to
to  , indicating that the BWC component is statistically significant. The small and consistent change in the BWC and MCC velocity shift suggests that the BWC should be a persistent feature, potentially associated with outflows or disc winds, relatively unaffected by changes in the AGN's overall state (see the discussion in Sect. 4).
During the bright state, the BWC has a luminosity of logL=42.34±0.04 erg/s and a FWHM of 2333±69 km/s, while the MCC is more luminous at logL=42.93±0.01 erg/s and exhibits a broader FWHM of 10736±641 km/s. In the dim state, the BWC's luminosity slightly decreases to log(L)=41.69±0.10 erg/s, with an increased FWHM of 3599±670 km/s, while the MCC's luminosity reduces to log(L)=42.64±0.02 erg/s, with the FWHM increased to 14955±2388 km/s. The luminosity ratio for the BWC and MCC is 3.9 in the bright state and 8.8 in the dim state, suggesting that the BWC might be more sensitive to the luminosity change. We summarise the BWC and MCC fitting results in Table 1.
Fitting results of broad Hα for DESI and SDSS.
The differences in velocity shifts and line properties between the bright and dim states point to complex dynamics within the BLR in J0759. The persistence of the BWC across states suggests that it is linked to a distinct and independent radiation region. At the same time, the overall varying asymmetry appears more sensitive to the AGN's activity state, possibly reflecting changes in the accretion rate or the effective radiation region of the BLR. In particular, the relative enhancement of the blueshifted component during higher luminosity states may point to a variable outflow component superimposed on a disc-like BLR. Such outflows could be strengthened during phases of elevated accretion and radiation pressure. Further spectral observations of the profile, especially if a re-brightening occurs, are necessary to pinpoint the exact processes driving the broad emission line features and their connection to the CL phenomena in J0759.
3.3. Multi-wavelength properties
Radio. By adopting the second epoch VLASS flux at 2–4 GHz and converting it to the rest-frame 5 GHz flux, we derived the lower limit of the radio-loudness parameter for J0759 as logR=L5GHz/L2500=2.08, which indicates that J0759 falls into the category of radio-loud AGNs. It is worth mentioning that Richards et al. (2011) reported a correlation between radio loudness and outflow signatures in C IV, suggesting that radio-loud AGNs exhibit stronger outflows, which could be relevant to the observed profile asymmetries in J0759.
Compared to the 10.03 mJy flux estimated from the FIRST observations, the radio flux has decreased by 30–40% in the VLASS observation (13.4 years in the rest frame). Since the FIRST observations were taken six years before the SDSS spectrum, and there are no corresponding photometric data to evaluate variability, we cannot establish a direct connection between the changes in radio flux and the CL events in J0759.
As both VLASS observations correspond to the optical low state, the radio flux did not show significant variability, with only a 9.27% decrease between the two epochs. This suggests that the source did not undergo dramatic changes in its radio state during this period. Future coordinated radio observations during the optical high state will be valuable for understanding the connection between radio emission and CL events, especially whether there is a transition between radio-loud and radio-quiet states.
Mid-infrared. The mid-infrared W1–W2 colour variations, depicted as grey dots in the top panel of Fig. 4, exhibit subtle changes in J0759, with a variation of 3.7% (0.053 magnitude) and a 2% variability uncertainty. However, in terms of the overall trend in colour variations, J0759 becomes slightly redder as it brightens. Such a trend aligns with statistical findings on mid-infrared variability in CL-AGNs reported by Yang et al. (2018), where similar colour variations were observed in a large sample of CL-AGNs (Sheng et al. 2017).
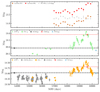 |
Fig. 4. Long-term light curve for J0759. Top panel: W1, W2, and W1-W2 light curves from NEOWISE. Middle and bottom panels: g- and r-band light curves from PS1 and ZTF, respectively. The bottom panel also includes the scaled CRTS V-band data, calibrated as described in Sect. 2. Spectral pseudo-photometry for the g and r bands is indicated with red, black, and blue ‘x’ markers, representing DESI, SDSS, and BTA, respectively. The dotted red line and dashed black line represent the pseudo-photometric magnitudes from SDSS and DESI, respectively. Note: The optical light curves are presented in AB magnitudes, while the mid-infrared light curves are in Vega magnitudes. |
The time lag measurements from MICA, comparing the optical and mid-infrared bands, are shown in the left two panels of Fig. 5, with  days and
  days in the observed frame. These time lags are consistent with the dusty torus sizes measured by Chen et al. (2023) for the general AGN population and by Yang et al. (2023) for CL-AGNs.
 |
Fig. 5. MICA time lags between the ZTF g band and the NEOWISE W1 and W2 bands. Left panels: Histograms of the distribution of the Gaussian centre values of the time delay between the W1/W2 band and the g band. Middle panels: Transfer functions for the W1 and W2 bands. Right panels (from top to bottom): Data and reconstructed light curves for the g band, W1 band, and W2 band. |
Optical. Using the method of Greene & Ho (2005), we combined the FWHM (8775±645 km/s) of the two Hα components and the total luminosity (logL=43.03±0.01 erg/s) to calculate the black hole mass as 108.81±0.06M⊙. Additionally, based on the Hα luminosity from the SDSS spectra, we estimated the low-state continuum luminosity at 5100 Å to be logL5100=44.26±0.03 erg/s using Eq. (1) from Greene & Ho (2005). Hence, the Eddington ratio for the low state is logλEdd=−2.04, which aligns well with values typically observed in CL-AGNs (MacLeod et al. 2016; Graham et al. 2020; Green et al. 2022; Zeltyn 2024; Guo et al. 2025).
X-ray and γ-ray. J0759 has not shown significant activity in the X-ray and gamma-ray bands. We have mainly relied on publicly available data from all-sky monitoring instruments such as the Fermi telescope and Rossi X-ray Timing Explorer (RXTE). However, due to the low sensitivity of these instruments, there are currently no detections for J0759. The source was also not detected in either individual scans or in the integrated map of the Mikhail Pavlinsky Astronomical Roentgen Telescope X-ray Concentrator (ART-XC) telescope on board the Spektr-Roentgen-Gamma (SRG) space observatory (Pavlinsky et al. 2021). The 2σ limit on the possible flux is 2.1×10⁻¹² erg/s/cm2 in the range 4–12 keV. To further explore J0759's properties in the high-energy bands, we have initiated observations using the Einstein Probe (EP), which is designed to monitor transient celestial events and has very high sensitivity (Yuan et al. 2015), making it particularly suitable for detecting rapid variability in sources like CL-AGNs. The X-ray data will significantly enhance our understanding of the physical processes in J0759 and may reveal its connection to the CL events.
4. Physical mechanism
The physical mechanisms behind RCL events need to be better constrained. In the case of J1628+4329, Zeltyn et al. (2022) suggest that rapid transitions might be explained by variable line-of-sight obscuration for two CL events. For other RCL events, Wang et al. (2024) propose that abrupt changes in the supply of circumnuclear gas likely drive fluctuations in the accretion rate, leading to these RCL transitions. However, it remains unclear whether the physical mechanisms driving RCL events on different timescales – whether spanning years, decades, or shorter periods – are the same.
4.1. Obscuration
For J0759, we argue that the obscuration model does not adequately explain the RCL events. First, it is unlikely that the observed asymmetry in the broad emission lines – especially in the low-state Hα line – could undergo significant profile changes solely due to extinction, unlike in the case of J1628+4329 (Zeltyn et al. 2022). While there are various extinction models, none can effectively transform the DESI spectrum into the spectral states observed in SDSS or BTA simply by varying the level of extinction. Figure 6 presents the results of two extinction tests from Fitzpatrick (1999), showing that no model significantly alters the asymmetry of the emission lines. It is important to note that the spectrum includes a host galaxy component that is not modelled here, but this does not affect our analysis of the emission lines.
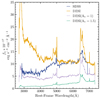 |
Fig. 6. Dust extinction test for J0759. The yellow and blue lines represent the DESI and SDSS spectra, respectively, while the purple and green spectra depict the DESI spectrum with extinction applied using an extinction curve with Av=1 (purple) and Av=1.5 (green). |
Another inconsistency with the obscuration model is the relatively strong radio emission in J0759, which would suggest the inclination is likely more face-on, according to the unified model (Antonucci 1993). In a face-on configuration, fewer fast-moving polar dust clouds would be along our line of sight, making it less likely that the BLR would be obscured (Urry & Padovani 1995). Furthermore, the possibility that J0759 has undergone multiple flares – with four to six potential CL events – further diminishes the probability of intermittent cloud obscuration. To explain such recurrent transitions via obscuration would require: (1) an atypically large population of dust clouds, exceeding the characteristic cloud numbers inferred from AGN torus models; (2) clouds of precisely aligned sizes to fully occult the continuum source, yet remain consistent with observed dust reverberation scales; and (3) orbital velocities fine-tuned to produce repetitive obscuration within the observed 1–2 year cadence. This tension becomes even more pronounced when considering the short transition timescale itself: obscuration-driven CL events typically exhibit decade-long timescales (LaMassa et al. 2015; Ruan et al. 2016), whereas J0759's recent RCL transition occurred within only two years. On such short timescales, even a maximally favourable cloud configuration required to produce the necessary obscuration becomes statistically implausible.
4.2. Driver of the accretion rate change
A dramatic accretion rate change is the most plausible physical mechanism driving the CL events in J0759. However, the dynamical timescales of theoretical accretion modes typically span thousands of years due to the viscous processes and thermal instabilities involved (Shakura & Sunyaev 1973; Kawaguchi et al. 1998). Notably, transitions between a standard accretion disc and an advection-dominated accretion flow are generally expected to occur over significantly longer timescales than the relatively brief transitions observed in CL-AGNs, which span only several years or decades (LaMassa et al. 2015; Noda & Done 2018; Graham et al. 2020; Green et al. 2022). In the case of J0759, modelling rapid transitions between a standard accretion disc and advection-dominated accretion flow with multiple flares and potential RCL events presents a particular challenge, suggesting that an additional physical mechanism is required to explain such frequent and rapid fluctuations. Here, we discuss two possible mechanisms that could potentially drive the rapid accretion rate changes in J0759.
4.2.1. A secondary SMBH
We explored the possibility of a secondary SMBH in J0759 based on two key aspects. (1) The double-peaked profile: J0759 exhibits a double-peaked broad emission line profile, which could potentially be explained by the presence of two distinct BLRs, each associated with one of the SMBHs in a binary system (Boroson & Lauer 2009; Doan et al. 2020). (2) Theoretical support for binary-induced CL events: Wang & Bon (2020) propose that CL events could result from the orbital motion of two SMBHs. Tidal interactions may drive these events as the black holes orbit each other, providing a plausible explanation for the CL transitions observed in J0759.
To test this scenario, we assumed that the BWC and MCC in the spectra originate from two independent BLRs, each linked to a distinct SMBH, without considering whether two BLRs could merge in SMBH binary models. Since spectral decomposition alone cannot yield precise individual black hole luminosities, we also followed the method of Greene & Ho (2005), using the Hα luminosity and FWHM to estimate the black hole masses. The estimated masses for the BWC and MCC in the bright state are approximately 107.25±0.03 M⊙ and 108.93±0.05 M⊙, respectively.
Assuming an orbital period of four years based on the potential CL events, the separation between the two black holes would be around 12 light-days. However, using the BWC's velocity shift of −4412 km/s, the calculated distance between the two black holes is approximately 224 light-days, corresponding to an orbital period of roughly 259 years. The significant discrepancy between the expected and calculated orbital periods suggests that the binary SMBH model with two independent BLRs does not fully align with the observed properties of J0759.
4.2.2. Chaotic accretion in a ring disc model
From a spectral perspective, the asymmetric Balmer broad emission lines in J0759 resemble those seen in 3C 332, Arp 102B, and 3C 390.3. These double-peaked profiles are typically attributed to emission from a flat, rotating, disc-like structure (Gezari et al. 2007), often referred to as the ring disc model, which predominantly occurs in radio-loud AGNs with low accretion rates. In this scenario, the BLR gas velocities reach tens of thousands of km/s as the line-emitting clouds reside outside the main accretion disc, forming discrete ring structures that are dynamically maintained by radiation pressure (Eracleous et al. 2009).
The observed BLR breathing effect in J0759 – where the AGN's continuum dimming enhances the prominence of high-velocity components from the inner ring region near the SMBH – aligns well with this model. This interpretation is further supported by J0759's radio-loudness, low accretion state, and asymmetric profile variations between high and low states, all of which are characteristic features of double-peaked profile systems (Eracleous et al. 2009).
A critical remaining question concerns the origin of J0759's rapid accretion rate fluctuations. We propose chaotic accretion (Gaspari et al. 2013) as a plausible mechanism, particularly in low-accretion-rate systems where radiation pressure dominance allows cloud survival. While direct observational evidence of chaotic (cold) accretion remains limited, the recurrence of CL transitions in J0759, combined with its double-peaked broad emission lines – indicative of a disc-like BLR – suggests a possible connection with this accretion mode. Similar line profile morphologies have been reported in CL AGNs such as 3C 332 (Wada et al. 2021), although this similarity is currently confined to the emission-line structure. More broadly, Wang et al. (2024) suggest that instabilities in circumnuclear cold gas can lead to stochastic accretion with characteristic timescales matching those of CL events. Therefore, while chaotic accretion remains only one possible explanation, it provides a physically motivated framework for understanding both the rapid spectral transitions and the geometry implied by the broad-line features. Further time-resolved observations will be necessary to test this scenario in more detail.
We therefore speculate that in J0759's ring disc configuration, chaotic accretion-driven collisions between elevated BLR clouds (particularly those above the disc plane) could disrupt Keplerian motion, enabling rapid inward spiralling. To systematically test this hypothesis, we are conducting a DESI-based search for CL-AGNs with double-peaked profiles and low-accretion properties. Statistical analysis will help establish potential connections between chaotic accretion signatures and CL phenomena.
5. Summary
We report on J0759, a unique radio-loud CL-AGN that undergoes RCL events and exhibits extreme asymmetry in the broad Hβ and Hα emission line profiles during its bright state. The light curve of J0759 indicates that four to six potential CL events took place over the last decade, presenting a significant challenge to our understanding of the underlying physical mechanism behind CL-AGNs. Several observations – the minimal mid-infrared colour variation, strong radio emission, and complex spectral line profile changes – rule out dust obscuration as the cause of the CL events in J0759. We have discussed two potential mechanisms that could drive the rapid changes in the accretion rate: (1) the orbital motion of a secondary SMBH and (2) chaotic accretion in a ring disc model. Long-term, multi-wavelength photometric and spectroscopic monitoring of J0759 will allow us to determine whether the CL events continue to recur and will help us uncover the physical mechanism behind the RCL phenomena.
Acknowledgments
We thank the referee for useful comments that significantly improve the manuscript. The work is supported by the funding supports from the National Key R&D Program of China (grant Nos. 2023YFA1608100, 2023YFA1607800 and 2022YFA1602902) and Strategic Priority Research Program of the Chinese Academy of Sciences with Grant Nos. XDB0550100 and XDB0550000. The authors also acknowledge the supports from the National Natural Science Foundation of China (NSFC; grant Nos. 12120101003, 12373010, 12173051, and 12233008), the National Key R&D Program of China (2023YFA1607804, and 2023YFF0714800), Beijing Municipal Natural Science Foundation (grant No. 1222028), and China Manned Space Project with Nos. CMS-CSST-2021-A02, CMS-CSST-2021-A04 and CMS-CSST-2021-A05. LCH was supported by the National Science Foundation of China (11991052, 12233001), the National Key R&D Program of China (2022YFF0503401), and the China Manned Space Project (CMS-CSST-2021-A04, CMS-CSST-2021-A06). VAF acknowledges funding from an United Kingdom Research and Innovation grant (code: MR/V022830/1). ZZX acknowledges financial support from the NSFC through grant No 12263003. C.C. is supported by the National Natural Science Foundation of China, No. 11803044, 11933003, 12173045. YRL acknowledges financial support from the NSFC through grant No 12273041 and from the Youth Innovation Promotion Associatin CAS. KXL acknowledges financial support from the NSFC (12073068), the Youth Innovation Promotion Association of Chinese Academy of Sciences (2022058), and the Young Talent Project of Yunnan Province. This material is based upon work supported by the U.S. Department of Energy (DOE), Office of Science, Office of High-Energy Physics, under Contract No. DE–AC02–05CH11231, and by the National Energy Research Scientific Computing Center, a DOE Office of Science User Facility under the same contract. Additional support for DESI was provided by the U.S. National Science Foundation (NSF), Division of Astronomical Sciences under Contract No. AST-0950945 to the NSF's National Optical-Infrared Astronomy Research Laboratory; the Science and Technology Facilities Council of the United Kingdom; the Gordon and Betty Moore Foundation; the Heising-Simons Foundation; the French Alternative Energies and Atomic Energy Commission (CEA); the National Council of Humanities, Science and Technology of Mexico (CONAHCYT); the Ministry of Science, Innovation and Universities of Spain (MICIU/AEI/10.13039/501100011033), and by the DESI Member Institutions: https://www.desi.lbl.gov/collaborating-institutions. Any opinions, findings, and conclusions or recommendations expressed in this material are those of the author(s) and do not necessarily reflect the views of the U. S. National Science Foundation, the U. S. Department of Energy, or any of the listed funding agencies. The authors are honored to be permitted to conduct scientific research on Iolkam Du’ag (Kitt Peak), a mountain with particular significance to the Tohono O’odham Nation. Observations with the SAO RAS telescopes are supported by the Ministry of Science and Higher Education of the Russian Federation. The renovation of telescope equipment is currently provided within the national project “Science and universities”. SDSS is managed by the Astrophysical Research Consortium for the Participating Institutions of the SDSS Collaboration including the Brazilian Participation Group, the Carnegie Institution for Science, Carnegie Mellon University, Center for Astrophysics | Harvard & Smithsonian, the Chilean Participation Group, the French Participation Group, Instituto de Astrofísica de Canarias, The Johns Hopkins University, Kavli Institute for the Physics and Mathematics of the Universe(IPMU)/University of Tokyo, the Korean Participation Group, Lawrence Berkeley National Laboratory, Leibniz Institut für Astrophysik Potsdam (AIP), Max-Planck-Institut für Astronomie (MPIA Heidelberg), Max-Planck-Institut für Astrophysik (MPA Garching), Max-Planck-Institut für ExtraterrestrischePhysik (MPE), National Astronomical Observatories of China, New Mexico State University, New York University, University of Notre Dame, Observatàrio Nacional/MCTI, The Ohio State University, Pennsylvania State University, Shanghai Astronomical Observatory, United Kingdom Participation Group, Universidad Nacional Autónoma de México, University of Arizona, University of Colorado Boulder, University of Oxford, University of Portsmouth, University of Utah, University of Virginia, University of Washington, University of Wisconsin, Vanderbilt University, and Yale University. The Catalina Sky Survey is funded by the National Aeronautics and Space Administration under Grant No. NNG05GF22G issued through the Science Mission Directorate Near-Earth Objects Observations Program. The CRTS survey is supported by the US National Science Foundation under grants AST-0909182 and AST-1313422. The CRTS survey is supported by the US National Science Foundation under grants AST-0909182 and AST-1313422. The PS1 has been made possible through contributions by the Institute for Astronomy, the University of Hawaii, the Pan-STARRS Project Office, the Max-Planck Society and its participating in- stitutes, the Max Planck Institute for Astronomy, Heidelberg and the Max Planck Institute for Extraterrestrial Physics, Garching, The Johns Hopkins University, Durham University, the University of Edinburgh, Queen's University BELfast, the Harvard-Smithsonian Center for Astrophysics, the Las Cumbres Observatory Global Telescope Network Incorporated, the National Central University of Taiwan, the Space Telescope Science Institute, the National Aeronautics and Space Administration under Grant No. NNX08AR22G issued through the Planetary Science Division of the NASA Science Mission Directorate, the National Science Foundation under Grant No. AST-1238877, the University of Maryland, and Eotvos Lorand University (ELTE). PTF image data are obtained with the Samuel Oschin Telescope and the 60 inch Telescope at the Palomar Observatory as part of the Palomar Transient Factory project, a scientific collaboration between the California Insti- tute of Technology, Columbia University, Las Cumbres Obser- vatory, the Lawrence Berkeley National Laboratory, the National Energy Research Scientific Computing Center, the University of Oxford, and the Weizmann Institute of Science. ZTF is supported by the National Science Foundation under Grant No. AST-2034437 and a collaboration including Caltech, IPAC, the Weizmann Institute for Science, the Oskar Klein Center at Stockholm University, the University of Maryland, Deutsches Elektronen-Synchrotron and Humboldt University, the TANGO Consortium of Taiwan, the University of Wis- consin at Milwaukee, Trinity College Dublin, Lawrence Livermore National Laboratories, and IN2P3, France. Operations are conducted by COO, IPAC, and UW.
References
- Afanasiev, V. L., & Moiseev, A. V. 2011, Balt. Astron., 20, 363 [NASA ADS] [Google Scholar]
- Alexander, D. M., & Hickox, R. C. 2012, NewAR, 56, 93 [Google Scholar]
- Antonucci, R. 1993, ARA&A, 31, 473 [Google Scholar]
- Becker, R. H., White, R. L., & Helfand, D. J. 1995, ApJ, 450, 559 [Google Scholar]
- Boroson, T. A., & Green, R. F. 1992, ApJS, 80, 109 [Google Scholar]
- Boroson, T. A., & Lauer, T. R. 2009, Nature, 458, 53 [Google Scholar]
- Bruzual, G., & Charlot, S. 2003, MNRAS, 344, 1000 [NASA ADS] [CrossRef] [Google Scholar]
- Chambers, K. C., Magnier, E. A., Metcalfe, N., et al. 2016, arXiv e-prints [arXiv:1612.05560] [Google Scholar]
- Chen, Y. -J., Bao, D. -W., Zhai, S., et al. 2023, MNRAS, 520, 1807 [NASA ADS] [CrossRef] [Google Scholar]
- Denney, K. D., De Rosa, G., Croxall, K., et al. 2014, ApJ, 796, 134 [Google Scholar]
- Doan, A., Eracleous, M., Runnoe, J. C., et al. 2020, MNRAS, 491, 1104 [Google Scholar]
- Drake, A. J., Djorgovski, S. G., Mahabal, A., et al. 2009, ApJ, 696, 870 [Google Scholar]
- Du, P. 2024, https://doi.org/10.5281/zenodo.12578529 [Google Scholar]
- Eracleous, M., Lewis, K. T., & Flohic, H. M. L. G. 2009, NewAR, 53, 133 [Google Scholar]
- Fitzpatrick, E. L. 1999, PASP, 111, 63 [Google Scholar]
- Gaspari, M., Ruszkowski, M., & Oh, S. P. 2013, MNRAS, 432, 3401 [NASA ADS] [CrossRef] [Google Scholar]
- Gezari, S., Halpern, J. P., & Eracleous, M. 2007, ApJS, 169, 167 [CrossRef] [Google Scholar]
- Giveon, U., Maoz, D., Kaspi, S., Netzer, H., & Smith, P. S. 1999, MNRAS, 306, 637 [NASA ADS] [CrossRef] [Google Scholar]
- Gordon, Y. A., Boyce, M. M., O’Dea, C. P., et al. 2021, ApJS, 255, 30 [NASA ADS] [CrossRef] [Google Scholar]
- Graham, M. J., Ross, N. P., Stern, D., et al. 2020, MNRAS, 491, 4925 [NASA ADS] [Google Scholar]
- Green, P. J., Pulgarin-Duque, L., Anderson, S. F., et al. 2022, ApJ, 933, 180 [NASA ADS] [CrossRef] [Google Scholar]
- Greene, J. E., & Ho, L. C. 2005, ApJ, 630, 122 [NASA ADS] [CrossRef] [Google Scholar]
- Guo, W. -J., Li, Y. -R., Zhang, Z. -X., Ho, L. C., & Wang, J. -M. 2022, ApJ, 929, 19 [NASA ADS] [CrossRef] [Google Scholar]
- Guo, W. -J., Zou, H., Fawcett, V. A., et al. 2024, ApJS, 270, 26 [NASA ADS] [CrossRef] [Google Scholar]
- Guo, W. -J., Zou, H., Greenwell, C. L., et al. 2025, ApJS, 278, 28 [Google Scholar]
- Helfand, D. J., White, R. L., & Becker, R. H. 2015, ApJ, 801, 26 [NASA ADS] [CrossRef] [Google Scholar]
- Ho, L. C. 2008, ARA&A, 46, 475 [Google Scholar]
- Husemann, B., Urrutia, T., Tremblay, G. R., et al. 2016, A&A, 593, L9 [NASA ADS] [CrossRef] [EDP Sciences] [Google Scholar]
- Kawaguchi, T., Mineshige, S., Umemura, M., & Turner, E. L. 1998, ApJ, 504, 671 [NASA ADS] [CrossRef] [Google Scholar]
- Khachikian, E. Ye., & Weedman, D. W. 1971, ApJ, 164, L109 [NASA ADS] [CrossRef] [Google Scholar]
- LaMassa, S. M., Cales, S., Moran, E. C., et al. 2015, ApJ, 800, 144 [NASA ADS] [CrossRef] [Google Scholar]
- Levi, M., Bebek, C., Beers, T., et al. 2013, arXiv e-prints [arXiv:1308.0847] [Google Scholar]
- Li, Y. -R., Wang, J. -M., Hu, C., Du, P., & Bai, J. -M. 2014, ApJ, 786, L6 [Google Scholar]
- Li, Y. -R., Wang, J. -M., & Bai, J. -M. 2016, ApJ, 831, 206 [NASA ADS] [CrossRef] [Google Scholar]
- Li, R., Ho, L. C., Ricci, C., et al. 2022, ApJ, 933, 70 [NASA ADS] [CrossRef] [Google Scholar]
- Lu, K. -X., Huang, Y. -K., Zhang, Z. -X., et al. 2019, ApJ, 877, 23 [NASA ADS] [CrossRef] [Google Scholar]
- Lyke, B. W., Higley, A. N., McLane, J. N., et al. 2020, ApJS, 250, 8 [NASA ADS] [CrossRef] [Google Scholar]
- MacLeod, C. L., Ross, N. P., Lawrence, A., et al. 2016, MNRAS, 457, 389 [Google Scholar]
- Mainzer, A., Bauer, J., Cutri, R. M., et al. 2014, ApJ, 792, 30 [Google Scholar]
- Masci, F. J., Laher, R. R., Rusholme, B., et al. 2019, PASP, 131, 018003 [Google Scholar]
- Mathur, S., Denney, K. D., Gupta, A., et al. 2018, ApJ, 866, 123 [NASA ADS] [CrossRef] [Google Scholar]
- Medford, M. S., Lu, J. R., & Schlafly, E. F. 2020, Res. Notes Am. Astron. Soc., 4, 38 [Google Scholar]
- Noda, H., & Done, C. 2018, MNRAS, 480, 3898 [Google Scholar]
- Osterbrock, D. E. 1981, ApJ, 249, 462 [Google Scholar]
- Pavlinsky, M., Tkachenko, A., Levin, V., et al. 2021, A&A, 650, A42 [EDP Sciences] [Google Scholar]
- Planck Collaboration VI. 2020, A&A, 641, A6 [NASA ADS] [CrossRef] [EDP Sciences] [Google Scholar]
- Rees, M. J. 1984, ARA&A, 22, 471 [Google Scholar]
- Ricci, C., & Trakhtenbrot, B. 2023, Nat. Astron., 7, 1282 [Google Scholar]
- Richards, G. T., Kruczek, N. E., Gallagher, S. C., et al. 2011, AJ, 141, 167 [Google Scholar]
- Ruan, J. J., Anderson, S. F., Cales, S. L., et al. 2016, ApJ, 826, 188 [NASA ADS] [CrossRef] [Google Scholar]
- Schlafly, E. F., & Finkbeiner, D. P. 2011, ApJ, 737, 103 [Google Scholar]
- Schlegel, D. J., Finkbeiner, D. P., & Davis, M. 1998, ApJ, 500, 525 [Google Scholar]
- Shakura, N. I., & Sunyaev, R. A. 1973, A&A, 500, 33 [NASA ADS] [Google Scholar]
- Shappee, B. J., Prieto, J. L., Grupe, D., et al. 2014, ApJ, 788, 48 [Google Scholar]
- Sheng, Z., Wang, T., Jiang, N., et al. 2017, ApJ, 846, L7 [NASA ADS] [CrossRef] [Google Scholar]
- Urry, C. M., & Padovani, P. 1995, PASP, 107, 803 [NASA ADS] [CrossRef] [Google Scholar]
- Vaughan, S., Edelson, R., Warwick, R. S., & Uttley, P. 2003, MNRAS, 345, 1271 [Google Scholar]
- Wada, K., Iwamuro, F., Nagoshi, S., & Saito, T. 2021, PASJ, 73, 596 [NASA ADS] [CrossRef] [Google Scholar]
- Wang, J. -M., & Bon, E. 2020, A&A, 643, L9 [NASA ADS] [CrossRef] [EDP Sciences] [Google Scholar]
- Wang, J., Xu, D. W., Cao, X., et al. 2024, ApJ, 970, 85 [NASA ADS] [CrossRef] [Google Scholar]
- Yang, Q., Wu, X. -B., Fan, X., et al. 2018, ApJ, 862, 109 [Google Scholar]
- Yang, Q., Green, P. J., MacLeod, C. L., et al. 2023, ApJ, 953, 61 [NASA ADS] [CrossRef] [Google Scholar]
- York, D. G., Adelman, J., Anderson, J. E. Jr, et al. 2000, AJ, 120, 1579 [NASA ADS] [CrossRef] [Google Scholar]
- Yuan, W., Zhang, C., & Feng, H. 2015, arXiv e-prints [arXiv:1506.07735] [Google Scholar]
- Zeltyn, G. 2024, ApJ, 966, 85 [NASA ADS] [CrossRef] [Google Scholar]
- Zeltyn, G., Trakhtenbrot, B., Eracleous, M., et al. 2022, ApJ, 939, L16 [NASA ADS] [CrossRef] [Google Scholar]
All Tables
All Figures
|
Fig. 1. Three optical spectra for J0759. Top panel: Smoothed spectra from SDSS (28 February 2006), DESI (27 January 2022), and BTA (10 January 2024) in orange, blue, and purple, respectively. Bottom panel: Differential spectra, with SDSS (BTA) and DESI represented by a green (brown) line. |
| In the text | |
|
Fig. 2. Spectral decomposition results (middle) and fitting residuals (bottom) for DESI (left) and SDSS (right). The top panels are a zoom-in decomposition of the Hβ and Hα regions. Shown are: the observed spectral data (black line), the best-fit model (red), the power-law continuum (purple), the host galaxy template (violet), the Fe ii pseudo-continuum template (pink), the Balmer continuum (teal), the narrow components (grey), the blue wing components (BWC; blue), and the main core components (MCC; yellow). The grey-shaded region marks the fitting window (3040 Å to 7200 Å). |
| In the text | |
|
Fig. 3. Velocity space of broad Mg ii (red), Hβ (jasper), and Hα (green) from DESI spectra. |
| In the text | |
|
Fig. 4. Long-term light curve for J0759. Top panel: W1, W2, and W1-W2 light curves from NEOWISE. Middle and bottom panels: g- and r-band light curves from PS1 and ZTF, respectively. The bottom panel also includes the scaled CRTS V-band data, calibrated as described in Sect. 2. Spectral pseudo-photometry for the g and r bands is indicated with red, black, and blue ‘x’ markers, representing DESI, SDSS, and BTA, respectively. The dotted red line and dashed black line represent the pseudo-photometric magnitudes from SDSS and DESI, respectively. Note: The optical light curves are presented in AB magnitudes, while the mid-infrared light curves are in Vega magnitudes. |
| In the text | |
|
Fig. 5. MICA time lags between the ZTF g band and the NEOWISE W1 and W2 bands. Left panels: Histograms of the distribution of the Gaussian centre values of the time delay between the W1/W2 band and the g band. Middle panels: Transfer functions for the W1 and W2 bands. Right panels (from top to bottom): Data and reconstructed light curves for the g band, W1 band, and W2 band. |
| In the text | |
|
Fig. 6. Dust extinction test for J0759. The yellow and blue lines represent the DESI and SDSS spectra, respectively, while the purple and green spectra depict the DESI spectrum with extinction applied using an extinction curve with Av=1 (purple) and Av=1.5 (green). |
| In the text | |
Current usage metrics show cumulative count of Article Views (full-text article views including HTML views, PDF and ePub downloads, according to the available data) and Abstracts Views on Vision4Press platform.
Data correspond to usage on the plateform after 2015. The current usage metrics is available 48-96 hours after online publication and is updated daily on week days.
Initial download of the metrics may take a while.