Fig. 2.
Download original image
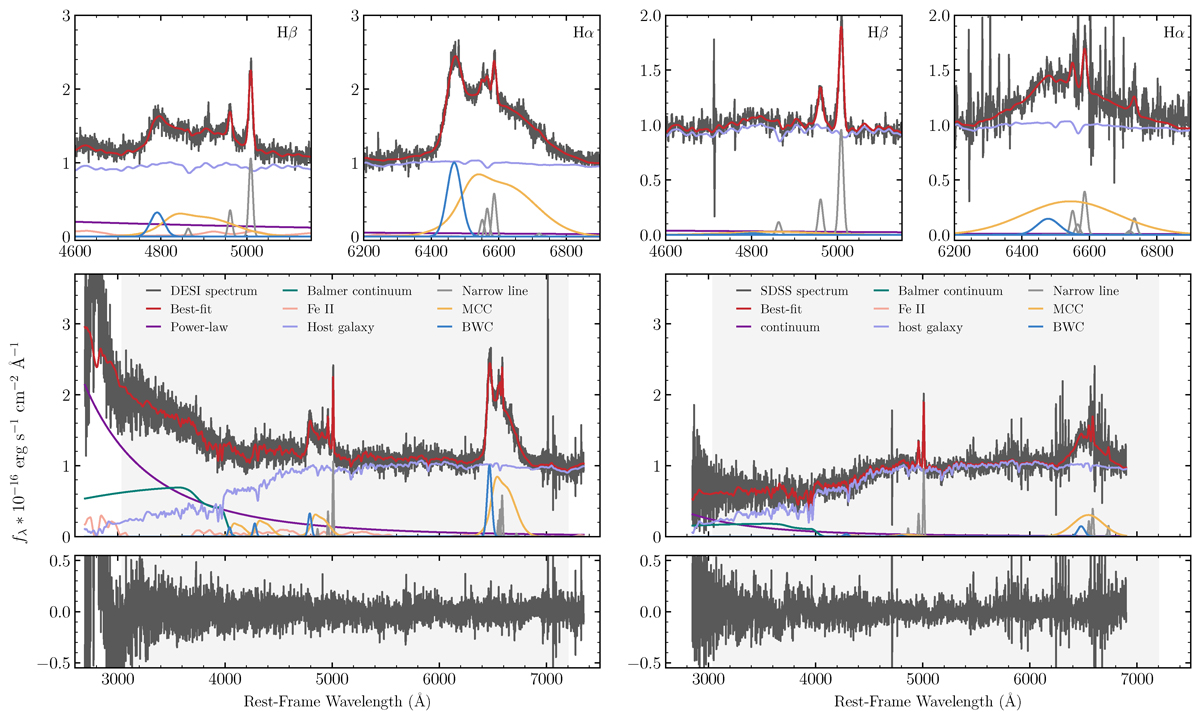
Spectral decomposition results (middle) and fitting residuals (bottom) for DESI (left) and SDSS (right). The top panels are a zoom-in decomposition of the Hβ and Hα regions. Shown are: the observed spectral data (black line), the best-fit model (red), the power-law continuum (purple), the host galaxy template (violet), the Fe ii pseudo-continuum template (pink), the Balmer continuum (teal), the narrow components (grey), the blue wing components (BWC; blue), and the main core components (MCC; yellow). The grey-shaded region marks the fitting window (3040 Å to 7200 Å).
Current usage metrics show cumulative count of Article Views (full-text article views including HTML views, PDF and ePub downloads, according to the available data) and Abstracts Views on Vision4Press platform.
Data correspond to usage on the plateform after 2015. The current usage metrics is available 48-96 hours after online publication and is updated daily on week days.
Initial download of the metrics may take a while.