Fig. 5.
Download original image
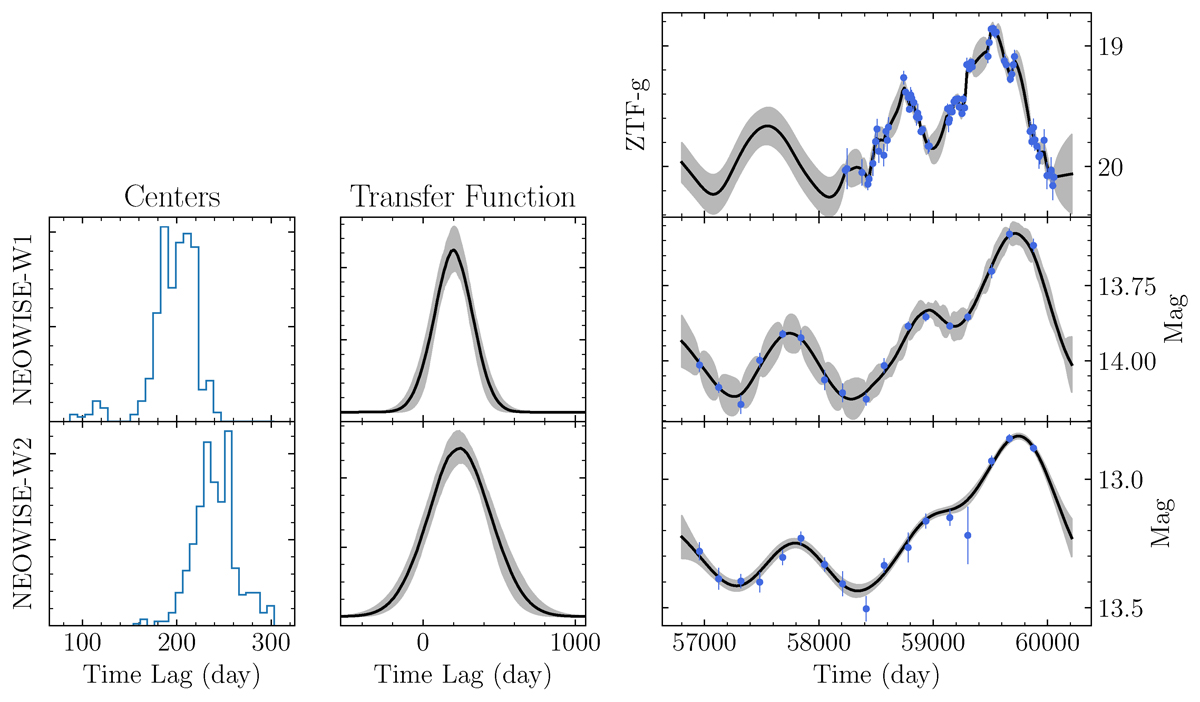
MICA time lags between the ZTF g band and the NEOWISE W1 and W2 bands. Left panels: Histograms of the distribution of the Gaussian centre values of the time delay between the W1/W2 band and the g band. Middle panels: Transfer functions for the W1 and W2 bands. Right panels (from top to bottom): Data and reconstructed light curves for the g band, W1 band, and W2 band.
Current usage metrics show cumulative count of Article Views (full-text article views including HTML views, PDF and ePub downloads, according to the available data) and Abstracts Views on Vision4Press platform.
Data correspond to usage on the plateform after 2015. The current usage metrics is available 48-96 hours after online publication and is updated daily on week days.
Initial download of the metrics may take a while.