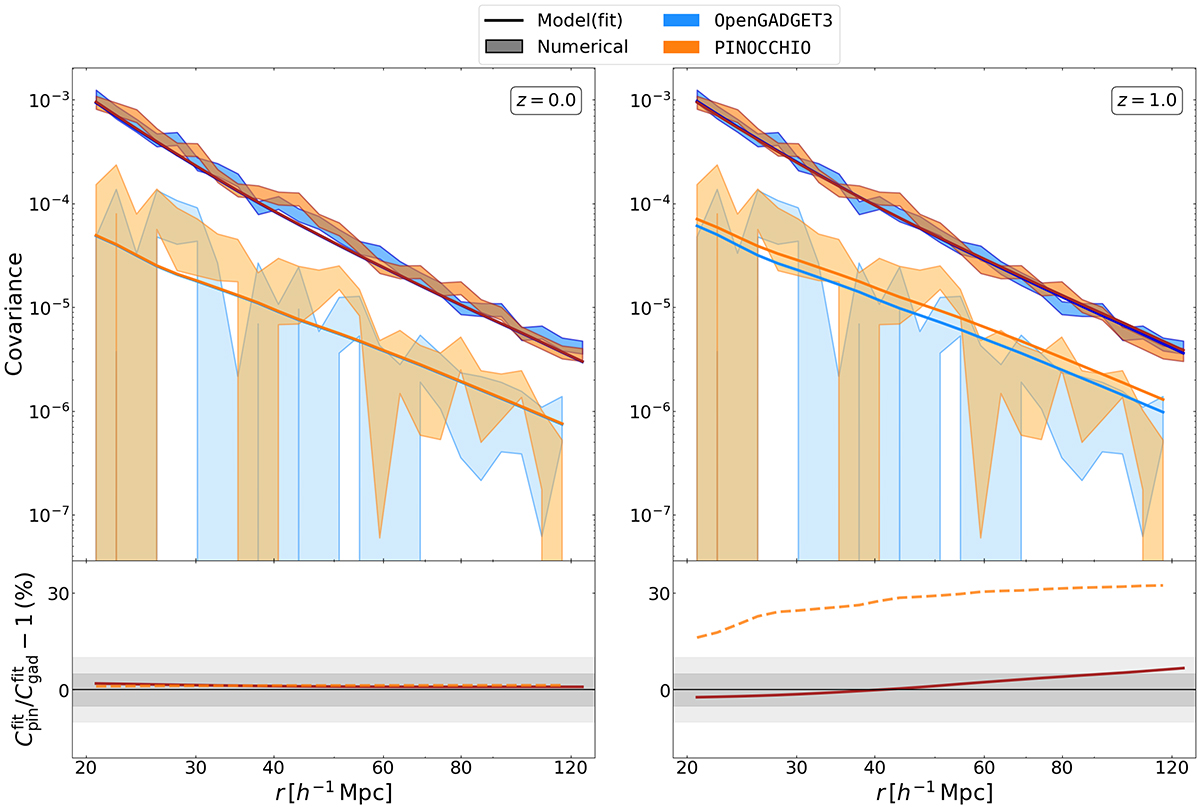
Fig. 7.
Download original image
Covariance comparison (box): PINOCCHIO vs. OpenGADGET3 covariance matrices, at z = 0 (left panel) and z = 1 (right panel). Shaded areas represent the numerical covariance within 1σ uncertainty, and solid lines are the semi-analytical prediction, with fitted parameters. Orange colors indicate PINOCCHIO covariance, while blue colors are for OpenGADGET3. Darker colors represent the diagonal terms, lighter colors the first off-diagonal terms. Bottom panels show the residuals of the PINOCCHIO fitted model with respect to the OpenGADGET3 one (solid line for the diagonal elements, dashed line for the off-diagonal ones).
Current usage metrics show cumulative count of Article Views (full-text article views including HTML views, PDF and ePub downloads, according to the available data) and Abstracts Views on Vision4Press platform.
Data correspond to usage on the plateform after 2015. The current usage metrics is available 48-96 hours after online publication and is updated daily on week days.
Initial download of the metrics may take a while.