| Issue |
A&A
Volume 697, May 2025
|
|
|---|---|---|
| Article Number | A57 | |
| Number of page(s) | 10 | |
| Section | Planets, planetary systems, and small bodies | |
| DOI | https://doi.org/10.1051/0004-6361/202554236 | |
| Published online | 07 May 2025 | |
AT2021uey: A planetary microlensing event outside the Galactic bulge
1
University of Warsaw, Astronomical Observatory,
Warszawa,
Poland
2
Taras Shevchenko National University of Kyiv,
Kyiv,
Ukraine
3
Université Paris-Saclay, CNRS/IN2P3,
IJCLab,
91405
Orsay,
France
4
Institute of Theoretical Physics and Astronomy, Vilnius University,
Vilnius,
Lithuania
5
Institut d’Astrophysique de Paris (IAP), Sorbonne Université, CNRS,
Paris,
France
6
IPAC, Mail Code 100-22, Caltech,
1200 E. California Blvd.,
Pasadena,
CA
91125,
USA
7
Dipartimento di Fisica “E.R. Caianiello”, Università di Salerno,
Fisciano,
Italy
8
Istituto Nazionale di Fisica Nucleare, Sezione di Napoli,
Napoli,
Italy
9
Flarestar Observatory,
San Gwann,
Malta
10
INAF, Osservatorio di Astrofisica e Scienza dello Spazio di Bologna,
Bologna,
Italy
11
School of Physics, Trinity College Dublin,
Dublin,
Ireland
12
Institut de Ciències del Cosmos (ICCUB), Universitat de Barcelona (UB),
Martì i Franquès 1,
08028
Barcelona,
Spain
13
University of St Andrews, Centre for Exoplanet Science, SUPA School of Physics & Astronomy,
UK
14
Public observatory Astrolab IRIS,
Zillebeke,
Belgium
15
Millennium Institute of Astrophysics MAS,
Nuncio Monsenor Sotero Sanz 100, Of. 104, Providencia,
Santiago,
Chile
16
Komaba Institute for Science, The University of Tokyo,
Tokyo,
Japan
17
Instituto de Astrofísica de Canarias (IAC),
Tenerife,
Spain
18
Institute of Earth System, University of Malta,
Malta
19
Znith Astronomy Observatory,
Malta
20
Zentrum für Astronomie der Universität Heidelberg, Astronomisches Rechen-Institut,
Heidelberg,
Germany
21
Evgeni Kharadze Georgian National Astrophysical Observatory,
Abastumani,
Georgia
22
Astronomical Institute, University of Wrocław,
ul. M. Kopernika 11,
51-622,
Wrocław,
Poland
23
Astrobiology Center,
Tokyo,
Japan
24
Horten videregående skole Horten,
Norway
25
Department of Particle Physics and Astrophysics, Weizmann Institute of Science,
Rehovot,
Israel
26
Las Cumbres Observatory Global Telescope Network,
6740 Cortona Drive, Suite 102,
Goleta,
CA
93117,
USA
27
Institute of Astronomy, Faculty of Physics, Astronomy and Informatics, Nicolaus Copernicus University in Toruń,
Toruń,
Poland
28
Institut d’Estudis Espacials de Catalunya (IEEC),
Esteve Terradas, 1, Edifici RDIT, Campus PMT-UPC,
08860
Castelldefels (Barcelona),
Spain
29
National Centre for Nuclear Research,
Pasteura 7,
02-093
Warsaw,
Poland
30
Janusz Gil Institute of Astronomy, University of Zielona Gora,
Lubuska 2,
65-265
Zielona Gora,
Poland
31
Astronomical Observatory, Jagiellonian University,
Orla 171,
30-244
Kraków,
Poland
32
Leibniz-Institut für Astrophysik Potsdam (AIP),
An der Sternwarte 16,
14482
Potsdam,
Germany
33
Instituto de Astrofísica, Facultad de Física, Pontificia Universidad Católica de Chile,
Av. Vicuña Mackenna 4860,
7820436
Macul, Santiago,
Chile
34
Departament de Física Quàntica i Astrofìsica (FQA), Universitat de Barcelona (UB),
Martì i Franquès 1,
08028
Barcelona,
Spain
35
Independent researcher,
Warszawa,
Poland
★ Corresponding author: This email address is being protected from spambots. You need JavaScript enabled to view it.
Received:
23
February
2025
Accepted:
26
March
2025
Abstract
We report the analysis of a planetary microlensing event AT2021uey. The event was observed outside the Galactic bulge and alerted both space-(Gaia) and ground-based (ZTF and ASAS-SN) surveys. From the observed data, we find that the lens system is located at a distance of ∼1 kpc and comprises an M-dwarf host star of about half a solar mass, orbited by a Jupiter-like planet beyond the snowline. The source star could be a metal-poor giant located in the halo according to the spectral analyses and modelling. Hence, AT2021uey is a unique example of the binary-lens event outside the bulge that is offered by a disc-halo lens-source combination.
Key words: gravitational lensing: micro / methods: observational / techniques: photometric / techniques: spectroscopic / planets and satellites: detection
© The Authors 2025
 Open Access article, published by EDP Sciences, under the terms of the Creative Commons Attribution License (https://creativecommons.org/licenses/by/4.0), which permits unrestricted use, distribution, and reproduction in any medium, provided the original work is properly cited.
This article is published in open access under the Subscribe to Open model. This email address is being protected from spambots. You need JavaScript enabled to view it. to support open access publication.
1 Introduction
Observations of gravitational microlensing events have the potential to find exoplanets and the event rate is by far the highest in the direction of the Galactic bulge (Paczynski 1991). Hence, microlensing surveys focused their observing efforts on the Galactic bulge (because of the highest event rate) and the Magellanic Clouds (in order to verify if low-mass black holes can be a main component of dark matter; Paczynski 1986) until a few years ago, and almost all microlensing planets were found towards the Galactic bulge. The exceptions are the planets TCP J05074264+2447555 Lb (also called Kojima-1 Lb; Nucita et al. 2018; Fukui et al. 2019) and Gaia22dkv Lb, the latter of which is the first microlensing planet discovered by Gaia (Wu et al. 2024). Here, we present the discovery of a third microlensing planet outside the Galactic bulge, called AT2021uey Lb. The event was found independently by the Gaia satellite (Gaia Collaboration 2016) and two ground-based surveys: the Zwicky Transient Facility (ZTF; Bellm et al. 2019; Masci et al. 2019) and the All Sky Automated Survey for SuperNovae (ASAS-SN; Shappee et al. 2014). The planetary anomaly has been covered by ZTF and ASAS-SN observations in a survey mode. Hence, this planet can be used in a future study to derive how the planet frequency and properties of planetary systems change with the Galactic position. Gaia22dkv Lb is one of the statistical sources for the planet frequency with the Galactic position, but Wu et al. (2024) indicate the alternative possibility of an M-dwarf planetary system other than the planetary system with a Sun-like host as they tentatively concluded. In contrast, Kojima-1 has no data from photometric surveys over the planetary anomaly; there are only two epochs from the ASAS-SN that are just after the anomaly (Nucita et al. 2018). Therefore, Kojima-1 Lb cannot be used for a statistical study of the Galactic distribution of microlensing planets (at least using standard methods).
We note that the Galactic latitude of AT2021uey ((l, b) = (77∘.91, −19∘.06)) is twice as large as for Kojima-1 ((l, b) = .(178∘.76, −9∘.33)) and Gaia22dkv ((l, b) = (287∘.37, −8∘.41)). The doubled latitude drastically reduces the density of stars along the line of sight, so the event occurrence rate also decreases. The baseline magnitude of the AT2021uey source is fainter than the sources of Kojima-1 and Gaia22dkv, and the photometric anomaly is observed before the main peak of the light curve, whilst Kojima-1 and Gaia22dkv show the anomalies around and after the main peak, respectively. In the case of an event that has a fainter source and an anomaly before the main peak, it is difficult for observers to immediately recognise the increase in the source brightness and alert other observatories of the need for a follow-up observation. The difficulty is attributed to the relative photometric noise and the risk of late alerting to cover the anomaly. Among the microlensing exoplanets archived in NASA’s Exoplanet Archive1, only ∼16% of them have an anomaly before the main peak that has been successfully observed. The average I-band source brightness of those events is ∼1-mag brighter than the other cases (i.e. an anomaly appears around the main peak or later). AT2021uey hits a lower occurrence rate in both the target region and the anomaly coverage, and the fainter source and decrease in anomaly coverage make the light curve more challenging to analyse.
It is well known that planet statistics (Winter et al. 2020) change as a function of host star metallicity (Fischer & Valenti 2005), mass (Eggenberger et al. 2007), and multiplicity (Johnson et al. 2010). Much less is known about how planet properties change with host star population or position in the Galaxy, even though ∼5000 exoplanets are known2. Most of these planets were found by the Kepler satellite in its original field (Christiansen 2022), which allows for planet frequency to be studied as a function of the position in only one direction. Kepler planets prevent us from gaining a full understanding of the architecture of planetary systems because all of these planets were found using a single technique – transits, in this case. Each planet detection technique has its own intrinsic biases and limitations and transits efficiently detect only close-in planets, with the sensitivity increasing with an increasing planet-to-star radius ratio. On the other hand, the microlensing technique (Mao & Paczynski 1991; Gould & Loeb 1992) discovers only wide-orbit planets and its sensitivity increases with an increasing planet-to-star mass ratio.
All exoplanets found via the microlensing technique except for TCP J05074264+2447555 Lb, Gaia22dkv Lb, and AT2021uey Lb are located in either the Galactic bulge or the Galactic disc because the event occurrence is attributed to the stellar population density (Kiraga & Paczynski 1994). The location of the microlensing events allows one to study whether the planets are more common in the bulge or in the disc towards the bulge. Unfortunately, it is hard to derive if a particular microlensing planet is in the bulge or a few kiloparsecs away in the disc. The distances to lenses can be found routinely if one compares the microlensing event light curve seen from several different observatories that are separated by a significant fraction of 1 AU (Gould 1992; Yee et al. 2015b); hence, the combination of ground- and space-based observatories is the first choice for such a stereo-visional method, called simultaneous parallax observation. The Spitzer satellite (Zhu et al. 2017) has been carrying out microlensing observations for a few years. The goal of these observations was to derive bulge-to-disc planet frequency ratio. However, Spitzer is not perfectly suited for such an experiment due to its small field of view. The small field of view necessitates a complex scheduling system to avoid bias in observations and ensure optimal resource utilisation (Yee et al. 2015a). Studies of the Galactic distribution of microlensing planets were also presented by Penny et al. (2016) and Koshimoto et al. (2021) but they based the distance estimates on parallaxes measured from the ground-based data. The final analysis of the whole Spitzer microlensing dataset has not yet been published and the ground-based estimates of planet frequency as a function of Galactic position are of low accuracy.
Recently, large-scale photometric surveys gained the ability to find microlensing events outside the bulge. These surveys are: the fourth phase of the Optical Gravitational Lensing project (OGLE-IV; Udalski et al. 2015; Mróz et al. 2020), ZTF (Rodriguez et al. 2022), ASAS-SN, Gaia (Wyrzykowski et al. 2023), and VVV (Husseiniova et al. 2021). The event rate per object gets smaller as we move further away from the Galactic plane and the event rate per sky area falls even more sharply (Mróz et al. 2020). Only a small fraction of microlensing events show clear planetary signatures and the combination of a Galactic latitude of −19.06 with a planetary signal makes AT2021uey a very rare event.
In this paper, we report the discovery of the planetary microlensing event, AT2021uey. In Sect. 2, we explain the background of the event observations, and then the light curve is analysed in Sect. 3. In Sect. 4, we first describe how we find the source distance and luminosity class from several approaches. In order to better constrain the source properties (and hence lens properties), we perform a simulation that is based on a Galactic model. Finally, the analysis of the lens properties is summarised in Sect. 5.
AT2021uey alert and baseline object properties from the Gaia DR3 catalogue (Gaia Collaboration 2021).
2 Observations
The ZTF survey (Bellm et al. 2019; Masci et al. 2019) announced the first alert at the position of AT2021uey on 11 June 2021. The alert was named ZTF18abktckv, and the confirmation of the microlensing nature of the alert was made three months later by the Fink broker3 (Möller et al. 2021) due to the peculiar shape of the signal. Thanks to Fink’s classification of this event as a microlensing candidate, the event AT2021uey caught the attention of the authors of this paper. The ASAS-SN survey (Shappee et al. 2014) recorded an alert for the event (or possibly transient) on 7 July 2021. The alert was named ASASSN-21mc. The ASAS-SN alert corresponds to a rapid increase in the observed light curve at the anomaly part, whilst the ZTF alert was offered much earlier by sensing a gradual increase in the observed light curve at the early stage of the event. These alerts were offered by the good observation timing and sensitivity, and they did not become a direct trigger of the follow-up observations.
The Gaia Science Alerts system (Hodgkin et al. 2013, 2021) alerted the astronomical community to the same event on 27 July 2021 as Gaia21dnc4. We summarise the general information about the Gaia alert and the Gaia DR3 (Gaia Collaboration 2016; Hodgkin et al. 2021) information about the catalogue star at the same position in Table 1. The alert was recognised to be a candidate microlensing event, which triggered follow-up observations by smaller telescopes. However, the alert and the follow-up observations ended up observing only the main peak, since the alert was issued after the anomaly peak. Follow-up data were uploaded and calibrated using the Black Hole Target Observation Manager (BHTOM5). BHTOM is a tool for coordinated observations and processing of photometric time series based on the open-source TOM Toolkit by LCO (Street et al. 2024) and uses the Cambridge Photometric Calibration Server (CPCS; Zieliński et al. 2019, 2020) and CCDPhot (Mikoĺajczyk et al., in prep.) that are the main kernels for data processing and calibration. The PSF photometry it computes is standardised to APASS or SDSS catalogues. The information about the telescopes involved in the photometric follow-up observations is provided in Table 2.
The imaging observations of the AT2021uey field started after the Gaia alert. The Observing Microlensing Events of the Galaxy Automatically Key Project (OMEGA6) started automatic observations on 11 August 2021 via the Microlensing Observing Platform (MOP7). Hundreds of SDSS-g′ and SDSS-i′ images have been collected. We also used a low-resolution spectrograph, OHP/Mistral8, and a high-resolution spectrograph, LBT/PEPSI9.
The light curve of AT2021uey is presented in Fig. 1. The main peak of the event is well covered by different datasets and is 1.5 mag brighter than the baseline. There is a 3-day long anomaly at HJD = 2 459 400 (i.e. 4 July 2021, 40 days before the main peak; see Fig. 2). During the anomaly, photometry was obtained only by the ASAS-SN and ZTF surveys. In total, nine epochs were collected during the anomaly. Among those anomaly epochs, the ASAS-SN survey collected two epochs that are 0.9 mag brighter than the main peak. We checked if the anomaly could have been produced by a nearby star or an instrumental effect. First, we searched for nearby stars in the Gaia DR3 and Pan-STARRS (Chambers et al. 2016) catalogues. The nearest object is at a separation of 6.4 arcsec and is too faint to be detected by either the ASAS-SN or ZTF surveys. The nearest star detectable by these surveys is 49.0 arcsec away from the event centroid and has G = 16.18 mag. We checked that this star is not variable in either ASAS-SN or ZTF data. Second, we inspected the images for the anomaly epochs and did not see any instrumental effects that could affect the photometry. Third, we noted that there are two ZTF anomaly epochs taken in different filters and that they show a similar brightness shift relative to the baseline, which is one more argument for the anomaly having a microlensing origin. In summary, we do not see any evidence against the anomaly having a microlensing origin.
Photometric data were cleaned up to remove outliers. We used the leave-one-out cross-validation method with  limitation for each epoch, i. This cleaning was not done for the anomaly part, and assumed a single-lens-single-source model. Finally, we decided to use photometric data from Gaia, ASASSN, ZTF, and LCO. Other datasets ensure that there are no other anomalies, but they do not constrain the event parameters significantly.
Photometric observations of the event AT2021uey.
3 Event parameters
There are several open-source tools to fit microlensing photometry. For AT2021uey, two tools are used: pyLIMA (Bachelet et al. 2017) and MulensModel (Poleski & Yee 2019). Both tools refer to VBBL (Bozza 2010; Bozza et al. 2018) during its process of binary lens magnification calculation. We found the best event parameters for which the theoretical light curve fits the photometric data using the Monte Carlo Markov chain (MCMC) algorithm. The resultant parameters fitted with both tools are in fair agreement with each other. The best-fitting light curve is shown in Fig. 1.
Fitted parameters of the event AT2021uey (1-sigma uncertainties quoted).
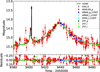 |
Fig. 1 Photometric data and fitted light curve of the event AT2021uey. The binary lens event is assumed. We show a zoomed-in light curve for the anomaly in Fig. 2. |
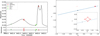 |
Fig. 2 Photometric data and fitted light curve of the anomaly part of the event AT2021uey (left panel) and the plot of the source trajectory in the lens frame (right panel). Only ASAS-SN and ZTF succeeded in detecting the anomaly. |
3.1 Model type
We tested both binary-lens and binary-source cases. Under the binary-source assumption, the MCMC chains do not converge. The binary-source assumption fails to fit the anomaly because there are two local maxima and a local minimum during the anomaly. Under the binary-lens assumption, the MCMC chains clearly converge on the best-fit light curve shown in Fig. 1 with reduced χ2 ∼ 1.1−1.6, depending on the data cleaning extent and parameter variations used in a fit.
3.2 Parameter distribution
The fundamental parameters for the binary lens event are: t0 – the time of the peak magnitude, u0 – the impact parameter at time t0, tE – the Einstein timescale of the event, q – the mass ratio of lens components, s – the separation of lens components, and α – the incident angle of the projected source path with respect to the planetary lens system. Additionally, we considered the angular source radius (ρ) for the finite source effect. Parameters u0, s, and ρ are relative to the Einstein radius (θE).
The source trajectory relative to caustics is presented in Fig. 2. The source first approached the cusp, then crossed the planetary caustic, and at the end passed the central caustic. The model light curve presents a characteristic U-shaped signal and the source is fully inside the caustic for a short time. The statistics of event parameter distributions are presented in Table 3. All of the parameters except for the angular source radius (ρ) converge on the normal distribution. For ρ, there is only an upper limit, which is determined by just the two brightest ASAS-SN epochs. According to our light curve fitting, the 99% upper limit of ρ is ∼0.0022.
We tried both wide (s > 1) and close (s < 1) models. Close models do not perform very well, and in particular fail to adequately reproduce the high-amplitude ASAS-SN epochs around HJD 2549403.10.
Source and blending magnitudes found through the light curve fitting for different bands.
3.3 Microlensing parallax and orbital motion
We checked if the microlensing parallax (πE) and orbital motion of the lens can be constrained by data. Using pyLIMA, we fitted the light curve with three approaches: a static model (SM) that is a basic model of a binary-lens event (described in Sect. 3.2), a full parallax model (FPM) that extends the SM with the addition of the northern and eastern components of the microlensing parallax, and a full parallax and circular orbital motion model (FPCOMM) that extends the FPM model with the addition of three parameters to describe the orbital motion of the lens. As a result, the six fundamental parameters of the binary-lens event and ρ result in similar estimates for the SM and FPM models, but in the case of the FPM model the microlensing parallax parameters are not really constrained (especially πEN). Concerning the FPCOMM model, we see that errors on all parameters shared with other models are bigger, and there are discrepancies in the values of estimated fundamental parameters with respect to other models. The reduced χ2 of all models are also similar. The best fit parameters with the SM show the reduced χ2 ∼ 1.14 for 1220 epochs, whilst both FPM and FPCOMM models only improve the reduced χ2 as ∼1.13 for the same epochs. Thus, we do not detect sufficient evidence of these additional effects, and consider the SM for the rest of the study.
3.4 Source and blending fluxes
The blending flux varies between 1.8% and 10.6% of the source flux in the g and i bands, respectively. Table 4 shows the estimated source and blending magnitude for each filter. Since the line of sight is not towards the galactic bulge, the extinction and the background noise are relatively small. The nearby stars are fairly separated from the source (see Sect. 2) so the blending from the nearby star is negligible. The light curve fitting under a binary source assumption failed, but there is a possibility that the source is an unresolved binary star under the large re-normalised unit weight error (RUWE) value of the Gaia observation (Lindegren et al. 2021). Both Gaia DR2 and DR3 show a large RUWE for the source; hence, the large RUWE is likely attributed to the wrong model assumption as a single star and it could be the unresolved binary source system. Even if such a companion exists, it is regarded as being below the unresolved magnitude of the Gaia sensitivity (i.e. ∼ 25.7 in G band; Gaia Collaboration 2016, 2018, 2021). Therefore, the blend light derived from the fitting is most likely emitted by the lens system itself. There is an extension of the analysis that the lens system has another bright host beyond the region of the microlensing effect, and the blend light is the sum of the two-host-one-planet system. However, the consideration is excessive since there is no signature so far, and we assume that most blending comes from a one-host-one-planet lens system.
Source properties found from spectroscopic data and the Galactic model.
4 Physical properties of the source and lens
4.1 Source properties
As Table 1 shows, the RUWE value is not at the acceptable level so that the estimated parallax and distance in Table 1 are uncertain. To find the source properties, we refer to spectroscopic data taken by OHP/Mistral and LBT/PEPSI and to the microlensing modelling approach using pyLIMASS (Bachelet et al. 2024) and the Besançon Galactic model (Robin et al. 2003; Marshall et al. 2006; Robin et al. 2012, 2014). The results of all the approaches are summarised in Table 5.
4.1.1 OHP/Mistral data
The OHP/Mistral10 is a low-resolution spectrograph (R ∼ 700) camera mounted on the 1.93-m telescope at OHP (Schmitt et al. 2024). The target AT2021uey (labelled as Gaia21dnc in the OHP/Mistral data) was observed on 6 September 2021 with an exposure time of 900 s. The spectrum was calibrated with ESO-MIDAS11 in a standard way, with the application of bias subtraction, flat-field normalisation, and wavelength (Hg, Ar, Xe arc lamps) and flux calibration.
Using the MISTRAL spectrum, especially the Hα-line region, we analysed the source properties, as is shown in the second row of Table 5 and Fig. 3. We fitted several synthetic spectra for a range of parameters (effective temperature, Teff, surface gravity, log g, metallicity, [M/H], and microturbulence velocity, vt) by using the iSpec12 framework for spectral analysis (Blanco-Cuaresma et al. 2014; Blanco-Cuaresma 2019) and the SPECTRUM13 radiative transfer code. We used the grid of MARCS atmospheric models (Gustafsson et al. 2008) and solar abundances provided by Grevesse et al. (2007). Figure 3 presents the best-fitted synthetic spectrum, comparing it with various other theoretical spectra that differ in Teff, log g, or [M/H]. It is clearly visible that the models of a hotter (5140 K) or cooler (5740 K) star, with a lower (1.00) or higher (4.50) surface gravity, or with a solar (0.00 dex) or higher-than-solar (+0.50 dex) metallicity, do not reflect the shape and intensity of the Hα spectral region.
Due to the low resolution of the data, low SNR ∼ 65, and poor weather conditions during observations, we were able to obtain the best fit but with relatively high uncertainties. In general, based on the OHP/Mistral data, the source star seems to be a metal-poor red giant. Finally, we assumed the line-of-sight extinction, AV = 0.21 mag, from Schlafly & Finkbeiner (2011) and estimated the source distance as Ds = 7.64 ± 1.93 kpc. The resultant source properties are also shown in the first row of Table 5.
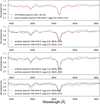 |
Fig. 3 (From top to bottom) OHP/Mistral spectrum (blue) and best-matching synthetic one (red). The same OHP/Mistral data (blue) but with two other synthetic spectra calculated for different Teff (5140 K green, and 5740 K – pink). The same OHP/Mistral data (blue) compared with two other synthetic spectra calculated for different log g (1.00 green, 4.50 – pink). The same OHP/Mistral data (blue) compared with two other synthetic spectra calculated for different [M/H] (0.00 – green, +0.50 – pink). All plots show the same spectral region around the Hα line. |
4.1.2 LBT/PEPSI data
LBT/PEPSI14 is a high-resolution (R > 50 000) optical echelle spectrograph mounted on the Large Binocular Telescope (LBT) with 2 × 8-m mirrors (Strassmeier et al. 2015). We proposed an observation for the AT2021uey source using LBT/PEPSI, and the observation was carried out on 3 June 2023 with an exposure time of 3600 s. LBT/PEPSI covers the blue arm range with CD-2 configuration (422–479 nm) and the range of two red arms with the CD-5 (623–744 nm) and CD-6 configuration (735–907 nm). This observational material was calibrated using the standard PEPSI software for stellar spectroscopy (Ilyin 2000), and we obtained a high-dispersion spectrum with an S/N ratio of around 70 in the blue part and 174 in the red part.
To fit the LBT/PEPSI data, we modified the Spyctres algorithm by Bachelet et al. (2022)15 to support the high-resolution PHOENIX templates (Husser et al. 2013) available online16. We then modelled several lines, including the Hα line and the calcium triplet lines Ca-II. Some of the spectral regions with the fitted model are shown in Fig. 4. As is summarised in Table 5, the spectrum lines are best described by a low-metallicity red giant model, with Teff = 5330 ± 30 K, log (g) = 2.22 ± 0.07 cgs, [Fe/H] = −1.21 ± 0.04, and a radial velocity of Vr ∼ 132 km/s.
Using isochrone models from MIST (Dotter 2016; Choi et al. 2016) with the above parameters and Av ∼ 0.21 as was done for OHP/Mistral, the distance to the source was estimated as DS ∼  kpc. The smaller uncertainty than for the result of the OHP/Mistral data analysis is attributed to the smaller deviations in the estimated effective temperature, metallicity, and surface gravity. The relatively metal-rich, weak-gravity estimation of the LBT/PEPSI data analysis compared with the OHP/Mistral data analysis results in a greater distance, though it is still within the deviation of the OHP/Mistral result. The resultant source properties are also shown in the second row of Table 5.
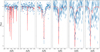 |
Fig. 4 LBT/PEPSI spectrum (blue dots) and best-matching model (red lines). From left to right, the plots show the spectral regions around Ca-I and some other components, Mg-II, Hα, and three Ca-II lines. |
4.1.3 Modelling using pyLIMASS
pyLIMASS is an algorithm for finding source-lens properties by analysing the observed data with stellar isochrone models, as is described in Bachelet et al. (2024). In the present case, we used constraints from the light curve modelling, namely tE, ρ, and the source magnitudes in the G, g′, and i′ bands. We also assumed that the blend light measured in the models is emitted by the lens, and therefore we also used the blend light in G, g′, and i′ bands in the pyLIMASS run. Similarly, we used the 2MASS measurements J = 14.073 ± 0.034 mag and Ks = 13.520 ± 0.032 mag (Cutri et al. 2003) as a constraint for the baseline magnitude (considered to be the sum of the source and the lens). Finally, we included a constraint on the visual absorption, AV = 0.2 ± 0.1, from the NASA/IPAC Extragalactic Database17 (Schlafly & Finkbeiner 2011). The resultant source properties are also shown in the third row of Table 5. The lens distance and mass simultaneously derived via this pyLIMASS modelling are DL ∼ 1.1 ± 0.2 kpc and ML ∼ 0.63 ± 0.07 [M⊙], respectively.
4.1.4 Modelling using the Besancon Galactic model
The Besançon Galactic model is a simulation tool to generate a stellar catalogue for a given line of sight (Robin et al. 2003; Marshall et al. 2006; Robin et al. 2012, 2014). The stellar catalogue for the simulation was taken from version m 161218. The stellar data in the catalogue were generated along the line of sight up to 15.0 kpc away from the Sun, and the catalogue contains main-sequence stars in the MK spectral system, asymptotic giant branch giant stars, and white dwarfs with a population ratio of MK:AGB:WD=1568.43:0.00017:0.0177. Using the stellar catalogue, we simulated the microlensing event models, focusing on the source properties.
The Besançon model uses the Johnson-Cousins filtering system so we considered the magnitude constraints of the source and lens in the V band converted from the g and r bands of ZTF. Tonry et al. (2012) and Medford et al. (2020) show the correspondence of the magnitude in the g and r bands between ZTF and Pan-STARRS and the conversion to some Johnson-Cousins filters. Although the conversion equations of Tonry et al. (2012) are in the Vega system, whilst ZTF, Pan-STARRS and the Besançon model are in the AB system, the difference between them in the V band is usually small for the main-sequence stars. Using these conversion equations and sample event parameters from the light curve fitting process, we derived the source magnitude, VS = 15.704 ± 0.010, and the blending magnitude, Vb = 19.142 ± 0.254.
We also took into account the colour index, proper motion, and type of star from the Gaia data. Using the filter conversion formula (van Leeuwen et al. 2018) of Gaia, we derived the colour in V−I as 0.855 ± 0.068, with the correlation between V and V−I being −1.353 × 10⁻³. The proper motion in celestial coordinates was also converted into galactic co-ordinates to adjust for the catalogue from the Besançon model, and we obtained (μl, μb) = (−9.160 ± 0.035, 1.990 ± 0.041), with a correlation of −0.419. The constraint of the proper motion was not directly applied but applied with the distribution of possible lens proper motions in the form of the magnitude of the relative proper motions. The Gaia data also indicates that the source is likely to be a red giant or a sub-giant because the colour is redder with a high surface gravity, but it has a hotter effective temperature than the typical main-sequence K–stars and M–dwarfs. These values from Gaia are based on the low resolution of BP/RP spectra and are suspicious, as a parallax value is, but the hotter tendencies are plausible. Therefore, we applied the initial cut-off for the effective temperature range (4250 < Teff < 6000 [K]) and an upper cut-off for the surface gravity (log (g) < 4.0; Hekker et al. 2011), and the cut-offs were adjusted during the effective sampling process using Besançon catalogues.
By applying the above constraints and the event likelihood from the light curve fitting (Tables 3 and 4) to the Besançon catalogue, we modelled the source stars and confirmed that both a red giant and a sub-giant are possible, as we expected. The most probable case is the metal-poor red giant according to the weights of tested samples, and its properties are in reasonable agreement with the results from the other three approaches (OHP/Mistral, LBT/PEPSI, and pyLIMASS). In this modelling, the red giant source tends to be located at  kpc. The resultant source properties are also shown in the fourth row of Table 5.
4.1.5 Summary of the source properties
Based on all the different approaches to analysing the source properties, the stellar type is a metal-poor red giant. The estimated distance is also fairly consistent among the approaches, partially overlapping the deviations. Because the line of sight for AT2021uey is towards the bulge, the greater distance indicates that the source has a high probability of being in the halo. The halo stars are generally old, and this point also supports the estimated low metallicity. Thus, these four approaches are acceptable, and we determined the final result of the source properties by combining these estimations, as is shown in the bottom row of Table 5. We assumed that the results from LBT/PEPSI data offer the most reliable and realistic solution, and we weighted the results from the other approaches by using relative Q-functions for the LBT/PEPSI’s deviation. The values from the event models (pyLIMASS and Besançon) were used more for reference purposes as we finalised the solution, since the direct observation of spectra is much more reliable for the stellar parameter estimation. With the final solution in Table 5 and the stellar catalogue from the Besançon model, we find that the radius of the source is  R⊙ with an absolute V-magnitude of
  .
.
Lns properties derived from the event simulation.
4.2 Lens results
Using the Besançon catalogue, we simulated the event once again by focusing on the lens properties. The event parameters from Sect. 3 and the source properties from Sect. 4.1 were applied as constraints during the event sampling. The luminosity, radius, and effective temperature of a lens host star were calculated using the mass relationships presented by Cuntz & Wang (2018) and Parsons et al. (2018). For the lens-planet system, we assume that the eccentricity and the longitude of the ascending node of the lens system are zero. Since the projected separation between the lens host and planet is larger than the Einstein radius, we can assume that the physical separation is also large enough to make the orbital motion effect negligible with respect to the Einstein timescale. In this case, any input of the projected position of the planet in the sky can be covered by the inclination of the orbital plane and the current position (i.e. true anomaly), and we can simplify the eccentricity and the longitude of the ascending node. Then, the semi-major axis was derived from the inclination, true anomaly, distance to the system (DL), and the projected separation of the host and planetary lenses (s) in the observer frame. Each set of event parameters was tested ten times by randomly selecting the inclination and true anomaly every time to reduce sampling noise.
Table 6 summarises the weighted mean and deviations for the lens parameters. Since our observation target is not towards the Galactic bulge, it is plausible that the lens system is located close to us. The pyLIMASS modelling discussed in Sect. 4.1.3 results in almost the same distance to the lens. The results of the Besançon and pyLIMASS approaches also agree on roughly about a half solar mass. Such a mass and the low temperature indicate that the lens star is an M-dwarf. The snowline of such a dwarf star is generally <1 AU (Mulders et al. 2015), and therefore the derived separation of the lens system indicates that the lens star has a Jupiter-like companion beyond its snowline. With the estimated lens distance and mass, the spatial visualisation of AT2021uey compared with Kojima-1, Gaia22dkv, and other exoplanet microlensing events towards the bulge is summarised in Fig. 5.
5 Conclusions
We estimate that the lens of the event AT2021uey is an M-dwarf (M* ∼  [M⊙]) that has a Jupiter-like planet
 ![Mathematical equation: $(M_{p l} \sim 1.34_{-0.50}^{+0.45}[M_{Jup}])$](/articles/aa/full_html/2025/05/aa54236-25/aa54236-25-eq24.png) beyond the snowline. The derived semimajor axis and the orbital period are the optimised values that one obtains by ignoring the eccentricity and orbital phase. The planet may move within the snowline if it has a strict eccentricity, but it is still true that the planet spends the most time in frozen circumstances. Since the combination of ASAS-SN and ZTF data successfully shows a unique feature of the anomaly (Fig. 2), we have been able to fit the light curve properly and confirm the existence of a planet beyond the snowline. On the other hand, there have been some issues identifying the source properties. By applying several stellar observations and modelling, we have finalised that the source star is likely located in the halo. Since the other binary-lens event examples out of the Galactic bulge (TCP J05074264+2447555 and Gaia22dkv) are disc-disc events, AT2021uey is a unique third example as a disc-halo event that was successfully observed.
beyond the snowline. The derived semimajor axis and the orbital period are the optimised values that one obtains by ignoring the eccentricity and orbital phase. The planet may move within the snowline if it has a strict eccentricity, but it is still true that the planet spends the most time in frozen circumstances. Since the combination of ASAS-SN and ZTF data successfully shows a unique feature of the anomaly (Fig. 2), we have been able to fit the light curve properly and confirm the existence of a planet beyond the snowline. On the other hand, there have been some issues identifying the source properties. By applying several stellar observations and modelling, we have finalised that the source star is likely located in the halo. Since the other binary-lens event examples out of the Galactic bulge (TCP J05074264+2447555 and Gaia22dkv) are disc-disc events, AT2021uey is a unique third example as a disc-halo event that was successfully observed.
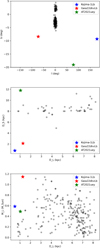 |
Fig. 5 Comparison for the exoplanet microlensing event distribution in the Galactic co-ordinates (top), the lens-source distance relation (middle), and the lens distance-mass relation (bottom). The coloured markers are the events outside the bulge, as is labelled in each panel, and the dark dots are the exoplanet microlensing events towards the bulge. Data was taken from the NASA Exoplanet Archive. Note that the scale on the top panel is very different between the longitude (l) and latitude (b) axes. |
Acknowledgements
Work by Makiko Ban and Radosław Poleski was supported by Polish National Agency for Academic Exchange grant “Polish Returns 2019.” This work was developed within the Fink community and made use of the Fink community broker resources. Julien Peloton thanks LSST-France and CNRS/IN2P3 for supporting Fink. We acknowledge ESA Gaia, DPAC and the Photometric Science Alerts Team19. Josep Manel Carrasco was (partially) supported by the Spanish MICIN/AEI/10.13039/501100011033 and by “ERDF A way of making Europe” by the “European Union” through grant PID2021-122842OB-C21, and the Institute of Cosmos Sciences University of Barcelona (ICCUB, Unidad de Excelencia ‘María de Maeztu’) through grant CEX2019-000918-M. The Joan Oró Telescope (TJO) of the Montsec Observatory (OdM) is owned by the Catalan Government and operated by the Institute for Space Studies of Catalonia (IEEC). Erika Paks̆tienė, Justas Zdanavic̆ius, Marius Maskoliūnas, Vytautas C̆epas, Rūta Urbonavic̆iūtė, Edita Stonkute acknowledge the support of the observations at Moletai AO from the Research Council of Lithuania (grant No. S-LL-24-1). Work by Akihiko Fukui and Norio Narita was partly supported by JSPS KAKENHI Grant Number JP17H02871, JP17H04574, JP18H05439, and JST CREST Grant Number JPMJCR1761. Yiannis Tsapras acknowledges the support of DFG priority program SPP 1992 “Exploring the Diversity of Extrasolar Planets” (TS 356/3-1). The project is supported by the European Union’s Horizon 2020 research and innovation program under grant agreement 101004719. We are grateful to Kornel Howil and Maja Jabłońska who created a simulation code for a low blending microlensing event (so-called Dark Lens Code; Howil et al. 2025) and offered the code on our demand though we have not used it in final analysis. We acknowledge the support from the European Union’s research and innovation programmes under grant agreements No. 101004719 (OPTICON-RadioNet Pilot, ORP) and No. 101131928 (ACME). We acknowledge the support from the Polish National Science Centre NCN grant DAINA No 2024/52/L/ST9/00210. This work was partially supported by a program of the Polish Ministry of Science under the title ‘Regional Excellence Initiative’, project no. RID/SP/0050/2024/1. Based on observations made at Observatoire de Haute Provence (CNRS), France, with MISTRAL on the T193 telescope. The LBT is an international collaboration among institutions in the United States, Italy and Germany. LBT Corporation partners are The Uni- versity of Arizona on behalf of the Arizona university system; Istituto Nazionale di Astrofisica, Italy; LBT Beteiligungsgesellschaft, Germany, representing the Max- Planck Society, the Astrophysical Institute Potsdam, and Heidelberg University; The Ohio State University, and The Research Corporation, on behalf of The Uni- versity of Notre Dame, University of Minnesota and the University of Virginia. This project used data obtained via BHTOM (https://bhtom.space), which has received funding from the European Union’s Horizon 2020 research and innovation programme under grant agreements No. 730890 (OPTICON) and 101004719 (ORP) and Horizon Europe programme No. 101131928 (ACME). R.F.J. acknowledges support for this project provided by ANID’s Millennium Science Initiative through grant ICN12_009, awarded to the Millennium Institute of Astrophysics (MAS), and by ANID’s Basal project FB210003.
References
- Bachelet, E., Norbury, M., Bozza, V., & Street, R., 2017, AJ, 154, 203 [NASA ADS] [CrossRef] [Google Scholar]
- Bachelet, E., Zieliński, P., Gromadzki, M., et al. 2022, A&A, 657, A17 [NASA ADS] [CrossRef] [EDP Sciences] [Google Scholar]
- Bachelet, E., Hundertmark, M., & Calchi Novati, S., 2024, AJ, 168, 24 [Google Scholar]
- Bellm, E. C., Kulkarni, S. R., Graham, M. J., et al. 2019, PASP, 131, 018002 [Google Scholar]
- Blanco-Cuaresma, S., 2019, MNRAS, 486, 2075 [Google Scholar]
- Blanco-Cuaresma, S., Soubiran, C., Heiter, U., & Jofré, P., 2014, A&A, 569, A111 [CrossRef] [EDP Sciences] [Google Scholar]
- Bozza, V. 2010, MNRAS, 408, 2188 [NASA ADS] [CrossRef] [Google Scholar]
- Bozza, V., Bachelet, E., Bartolić, F., et al. 2018, MNRAS, 479, 5157 [Google Scholar]
- Chambers, K. C., Magnier, E. A., Metcalfe, N., et al. 2016 [arXiv:1612.05560] [Google Scholar]
- Choi, J., Dotter, A., Conroy, C., et al. 2016, ApJ, 823, 102 [Google Scholar]
- Christiansen, J. L., 2022, Nat. Astron., 6, 516 [NASA ADS] [CrossRef] [Google Scholar]
- Cuntz, M., & Wang, Z., 2018, RNAAS, 2, 19 [NASA ADS] [Google Scholar]
- Cutri, R. M., Skrutskie, M. F., van Dyk, S., et al. 2003, 2MASS All Sky Catalog of point sources [Google Scholar]
- Dotter, A., 2016, ApJS, 222, 8 [Google Scholar]
- Eggenberger, A., Udry, S., Chauvin, G., et al. 2007, A&A, 474, 273 [NASA ADS] [CrossRef] [EDP Sciences] [Google Scholar]
- Fischer, D. A., & Valenti, J., 2005, ApJ, 622, 1102 [NASA ADS] [CrossRef] [Google Scholar]
- Fukui, A., Suzuki, D., Koshimoto, N., et al. 2019, AJ, 158, 206 [NASA ADS] [CrossRef] [Google Scholar]
- Gaia Collaboration (Prusti, T., et al.,) 2016, A&A, 595, A1 [NASA ADS] [CrossRef] [EDP Sciences] [Google Scholar]
- Gaia Collaboration (Brown, A. G. A., et al.,) 2018, A&A, 616, A1 [NASA ADS] [CrossRef] [EDP Sciences] [Google Scholar]
- Gaia Collaboration (Brown, A. G. A., et al.,) 2021, A&A, 649, A1 [NASA ADS] [CrossRef] [EDP Sciences] [Google Scholar]
- Gould, A., 1992, ApJ, 392, 442 [Google Scholar]
- Gould, A., & Loeb, A., 1992, ApJ, 396, 104 [Google Scholar]
- Grevesse, N., Asplund, M., & Sauval, A. J., 2007, Space Sci. Rev., 130, 105 [Google Scholar]
- Gustafsson, B., Edvardsson, B., Eriksson, K., et al. 2008, A&A, 486, 951 [NASA ADS] [CrossRef] [EDP Sciences] [Google Scholar]
- Hekker, S., Gilliland, R. L., Elsworth, Y., et al. 2011, MNRAS, 414, 2594 [Google Scholar]
- Hodgkin, S. T., Wyrzykowski, L., Blagorodnova, N., & Koposov, S., 2013, Philos. Trans. Roy. Soc. Lond. Ser. A, 371, 20120239 [Google Scholar]
- Hodgkin, S. T., Harrison, D. L., Breedt, E., et al. 2021, A&A, 652, A76 [NASA ADS] [CrossRef] [EDP Sciences] [Google Scholar]
- Howil, K., Wyrzykowski, Ł., Kruszyńska, K., et al. 2025, A&A, 694, A94 [NASA ADS] [CrossRef] [EDP Sciences] [Google Scholar]
- Husseiniova, A., McGill, P., Smith, L. C., & Evans, N. W., 2021, MNRAS, 506, 2482 [Google Scholar]
- Husser, T. O., Wende-von Berg, S., Dreizler, S., et al. 2013, A&A, 553, A6 [NASA ADS] [CrossRef] [EDP Sciences] [Google Scholar]
- Ilyin, I., 2000, Ph.D. Thesis, University of Oulu, Finland [Google Scholar]
- Johnson, J. A., Aller, K. M., Howard, A. W., & Crepp, J. R., 2010, PASP, 122, 905 [Google Scholar]
- Kiraga, M., & Paczynski, B., 1994, ApJ, 430, L101 [NASA ADS] [CrossRef] [Google Scholar]
- Koshimoto, N., Bennett, D. P., Suzuki, D., & Bond, I. A., 2021, ApJ, 918, L8 [NASA ADS] [CrossRef] [Google Scholar]
- Lindegren, L., Bastian, U., Biermann, M., et al. 2021, A&A, 649, A4 [EDP Sciences] [Google Scholar]
- Mao, S., & Paczynski, B., 1991, ApJ, 374, L37 [NASA ADS] [CrossRef] [Google Scholar]
- Marshall, D. J., Robin, A. C., Reylé, C., Schultheis, M., & Picaud, S., 2006, A&A, 453, 635 [NASA ADS] [CrossRef] [EDP Sciences] [Google Scholar]
- Masci, F. J., Laher, R. R., Rusholme, B., et al. 2019, PASP, 131, 018003 [Google Scholar]
- Medford, M. S., Lu, J. R., & Schlafly, E. F., 2020, RNAAS, 4, 38 [NASA ADS] [Google Scholar]
- Möller, A., Peloton, J., Ishida, E. E. O., et al. 2021, MNRAS, 501, 3272 [CrossRef] [Google Scholar]
- Mróz, P., Udalski, A., Szymański, M. K., et al. 2020, ApJS, 249, 16 [CrossRef] [Google Scholar]
- Mulders, G. D., Ciesla, F. J., Min, M., & Pascucci, I., 2015, ApJ, 807, 9 [NASA ADS] [CrossRef] [Google Scholar]
- Nucita, A. A., Licchelli, D., De Paolis, F., et al. 2018, MNRAS, 476, 2962 [NASA ADS] [CrossRef] [Google Scholar]
- Paczynski, B., 1986, ApJ, 304, 1 [NASA ADS] [CrossRef] [Google Scholar]
- Paczynski, B., 1991, ApJ, 371, L63 [CrossRef] [Google Scholar]
- Parsons, S. G., Gänsicke, B. T., Marsh, T. R., et al. 2018, MNRAS, 481, 1083 [Google Scholar]
- Penny, M. T., Henderson, C. B., & Clanton, C., 2016, ApJ, 830, 150 [NASA ADS] [CrossRef] [Google Scholar]
- Poleski, R., & Yee, J. C., 2019, Astron. Comput., 26, 35 [NASA ADS] [CrossRef] [Google Scholar]
- Robin, A. C., Reylé, C., Derrière, S., & Picaud, S., 2003, A&A, 409, 523 [NASA ADS] [CrossRef] [EDP Sciences] [Google Scholar]
- Robin, A. C., Marshall, D. J., Schultheis, M., & Reylé, C., 2012, A&A, 538, A106 [NASA ADS] [CrossRef] [EDP Sciences] [Google Scholar]
- Robin, A. C., Reylé, C., Fliri, J., et al. 2014, A&A, 569, A13 [CrossRef] [EDP Sciences] [Google Scholar]
- Rodriguez, A. C., Mróz, P., Kulkarni, S. R., et al. 2022, ApJ, 927, 150 [Google Scholar]
- Schlafly, E. F., & Finkbeiner, D. P., 2011, ApJ, 737, 103 [Google Scholar]
- Schmitt, J., Adami, C., Dennefeld, M., et al. 2024, A&A, 687, A198 [NASA ADS] [CrossRef] [EDP Sciences] [Google Scholar]
- Shappee, B., Prieto, J., Stanek, K. Z., et al. 2014, in American Astronomical Society Meeting Abstracts, 223, 236.03 [Google Scholar]
- Strassmeier, K. G., Ilyin, I., Järvinen, A., et al. 2015, Astron. Nachr., 336, 324 [NASA ADS] [CrossRef] [Google Scholar]
- Street, R. A., Lindstrom, W., Heinrich-Josties, E., et al. 2024, in Astromical Data Analysis Software and Systems XXXI, eds. B. V. Hugo, R. Van Rooyen, & O. M. Smirnov, Astronomical Society of the Pacific Conference Series, 535, 3 [Google Scholar]
- Tonry, J. L., Stubbs, C. W., Lykke, K. R., et al. 2012, ApJ, 750, 99 [Google Scholar]
- Udalski, A., Szymański, M. K., & Szymański, G., 2015, Acta Astron., 65, 1 [NASA ADS] [Google Scholar]
- van Leeuwen, F., de Bruijne, J. H. J., Arenou, F., et al. 2018, Gaia DR2 documentation [Google Scholar]
- Winter, A. J., Kruijssen, J. M. D., Longmore, S. N., & Chevance, M., 2020, Nature, 586, 528 [Google Scholar]
- Wu, Z., Dong, S., Yi, T., et al. 2024, AJ, 168, 62 [Google Scholar]
- Wyrzykowski, Ł., Kruszyńska, K., Rybicki, K. A.,, et al. 2023, A&A, 674, A23 [NASA ADS] [CrossRef] [EDP Sciences] [Google Scholar]
- Yee, J. C., Gould, A., Beichman, C., et al. 2015a, ApJ, 810, 155 [NASA ADS] [CrossRef] [Google Scholar]
- Yee, J. C., Udalski, A., Calchi Novati, S., et al. 2015b, ApJ, 802, 76 [Google Scholar]
- Zhu, W., Udalski, A., Novati, S. C., et al. 2017, AJ, 154, 210 [NASA ADS] [CrossRef] [Google Scholar]
- Zieliński, P., Wyrzykowski, Ł., Rybicki, K., et al. 2019, Contrib. Astron. Observ. Skalnate Pleso, 49, 125 [Google Scholar]
- Zieliński, P., Wyrzykowski, ł., Mikołajczyk, P., Rybicki, K., & Kołaczkowski, Z. 2020, in XXXIX Polish Astronomical Society Meeting, 10, eds. K. Małek, M. Polińska, A. Majczyna, et al. 190 [Google Scholar]
Retrieved from NASA Exoplanet Archive and Encyclopaedia of exoplanetary systems (https://exoplanet.eu/) cross-matching as of February 2025.
All Tables
AT2021uey alert and baseline object properties from the Gaia DR3 catalogue (Gaia Collaboration 2021).
Source and blending magnitudes found through the light curve fitting for different bands.
All Figures
|
Fig. 1 Photometric data and fitted light curve of the event AT2021uey. The binary lens event is assumed. We show a zoomed-in light curve for the anomaly in Fig. 2. |
| In the text | |
|
Fig. 2 Photometric data and fitted light curve of the anomaly part of the event AT2021uey (left panel) and the plot of the source trajectory in the lens frame (right panel). Only ASAS-SN and ZTF succeeded in detecting the anomaly. |
| In the text | |
|
Fig. 3 (From top to bottom) OHP/Mistral spectrum (blue) and best-matching synthetic one (red). The same OHP/Mistral data (blue) but with two other synthetic spectra calculated for different Teff (5140 K green, and 5740 K – pink). The same OHP/Mistral data (blue) compared with two other synthetic spectra calculated for different log g (1.00 green, 4.50 – pink). The same OHP/Mistral data (blue) compared with two other synthetic spectra calculated for different [M/H] (0.00 – green, +0.50 – pink). All plots show the same spectral region around the Hα line. |
| In the text | |
|
Fig. 4 LBT/PEPSI spectrum (blue dots) and best-matching model (red lines). From left to right, the plots show the spectral regions around Ca-I and some other components, Mg-II, Hα, and three Ca-II lines. |
| In the text | |
|
Fig. 5 Comparison for the exoplanet microlensing event distribution in the Galactic co-ordinates (top), the lens-source distance relation (middle), and the lens distance-mass relation (bottom). The coloured markers are the events outside the bulge, as is labelled in each panel, and the dark dots are the exoplanet microlensing events towards the bulge. Data was taken from the NASA Exoplanet Archive. Note that the scale on the top panel is very different between the longitude (l) and latitude (b) axes. |
| In the text | |
Current usage metrics show cumulative count of Article Views (full-text article views including HTML views, PDF and ePub downloads, according to the available data) and Abstracts Views on Vision4Press platform.
Data correspond to usage on the plateform after 2015. The current usage metrics is available 48-96 hours after online publication and is updated daily on week days.
Initial download of the metrics may take a while.