Fig. 5
Download original image
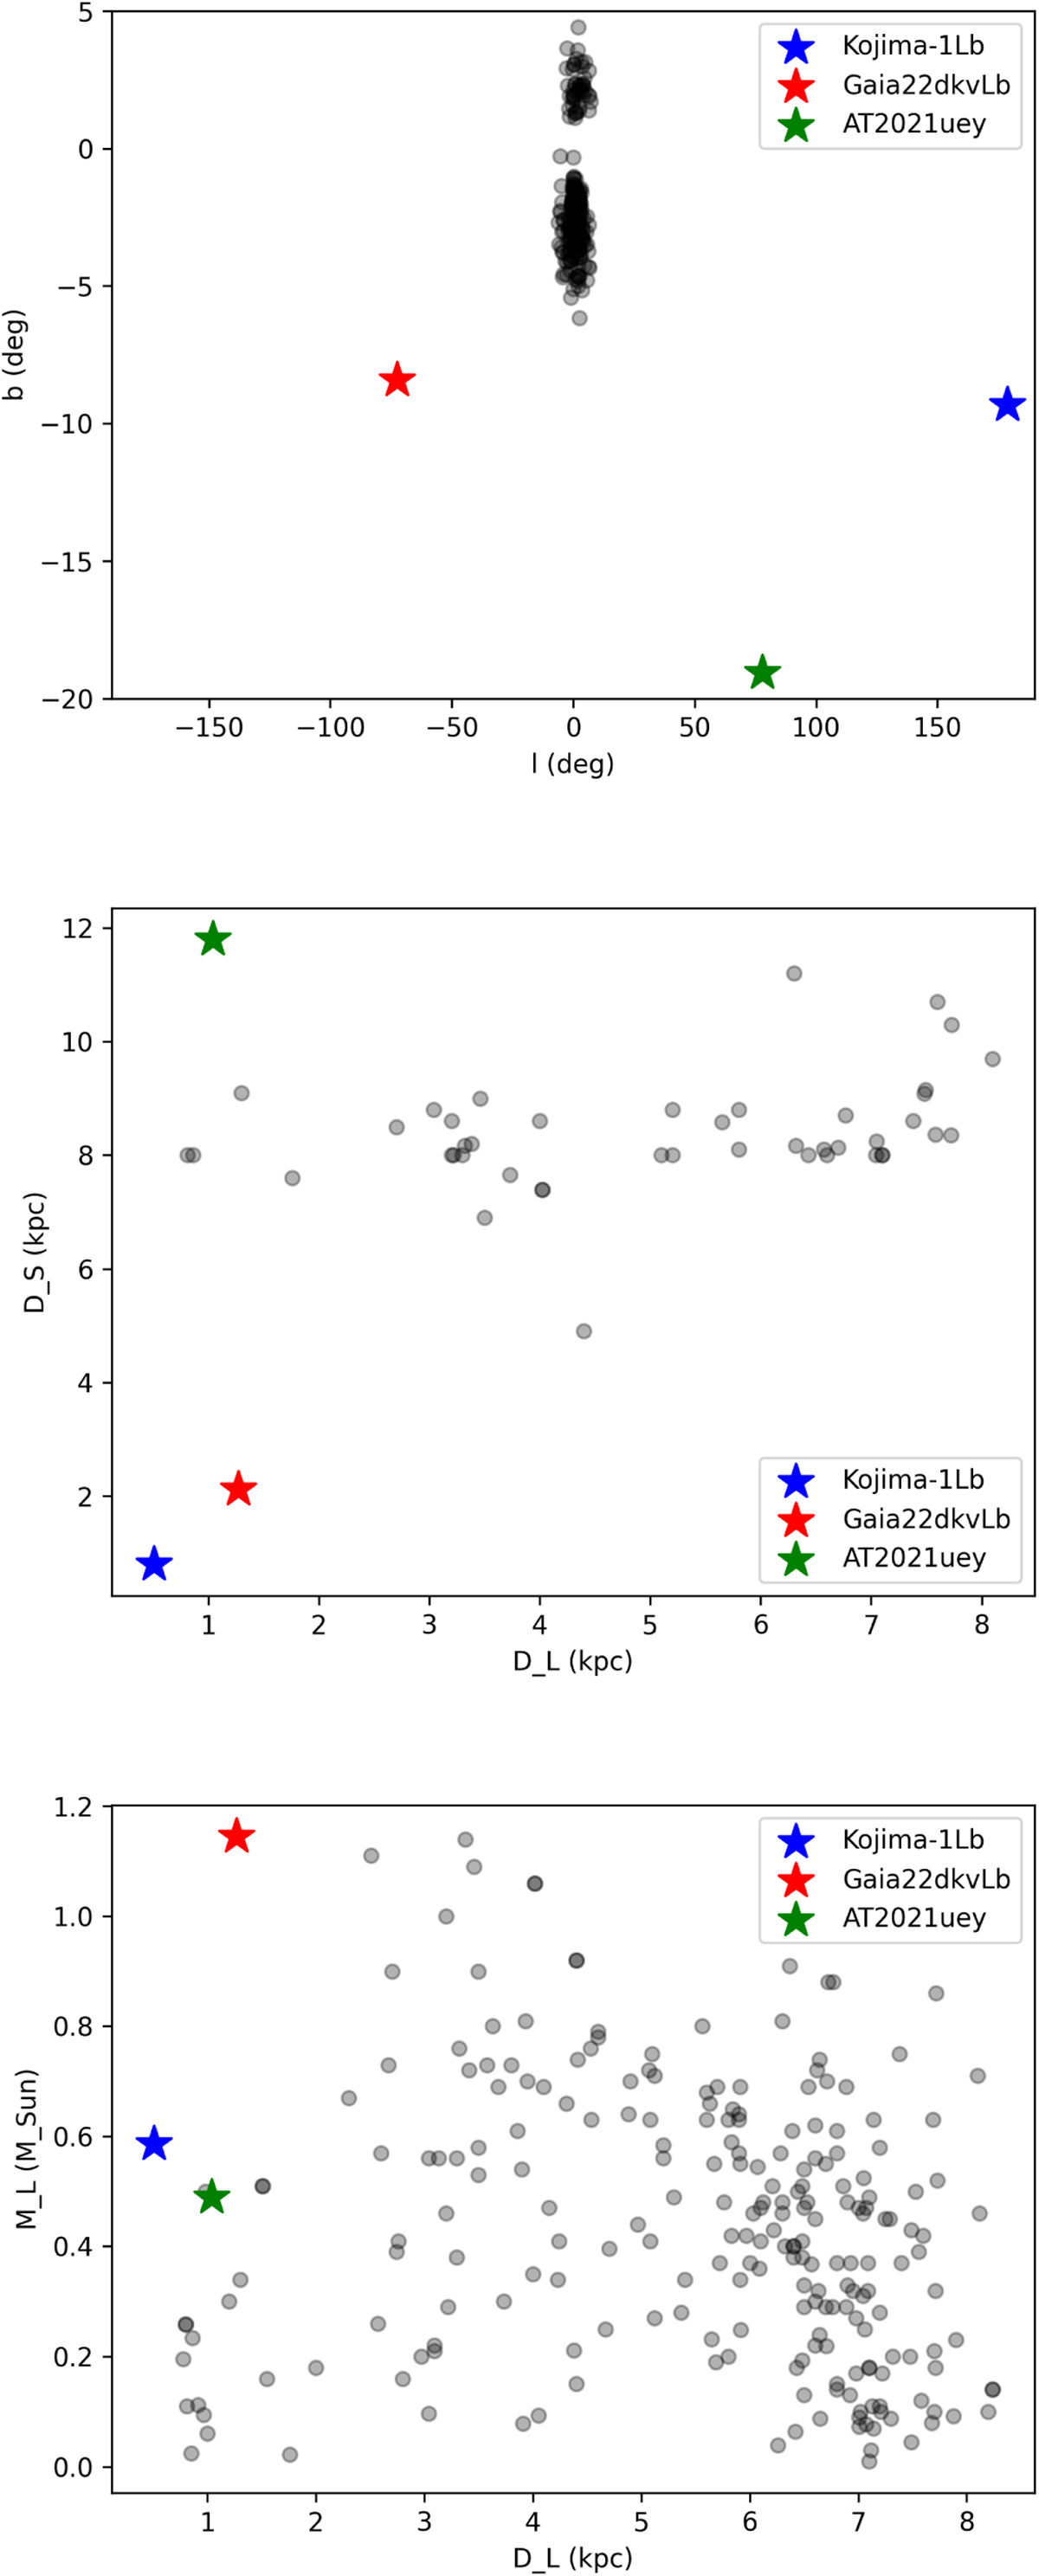
Comparison for the exoplanet microlensing event distribution in the Galactic co-ordinates (top), the lens-source distance relation (middle), and the lens distance-mass relation (bottom). The coloured markers are the events outside the bulge, as is labelled in each panel, and the dark dots are the exoplanet microlensing events towards the bulge. Data was taken from the NASA Exoplanet Archive. Note that the scale on the top panel is very different between the longitude (l) and latitude (b) axes.
Current usage metrics show cumulative count of Article Views (full-text article views including HTML views, PDF and ePub downloads, according to the available data) and Abstracts Views on Vision4Press platform.
Data correspond to usage on the plateform after 2015. The current usage metrics is available 48-96 hours after online publication and is updated daily on week days.
Initial download of the metrics may take a while.