Fig. 3
Download original image
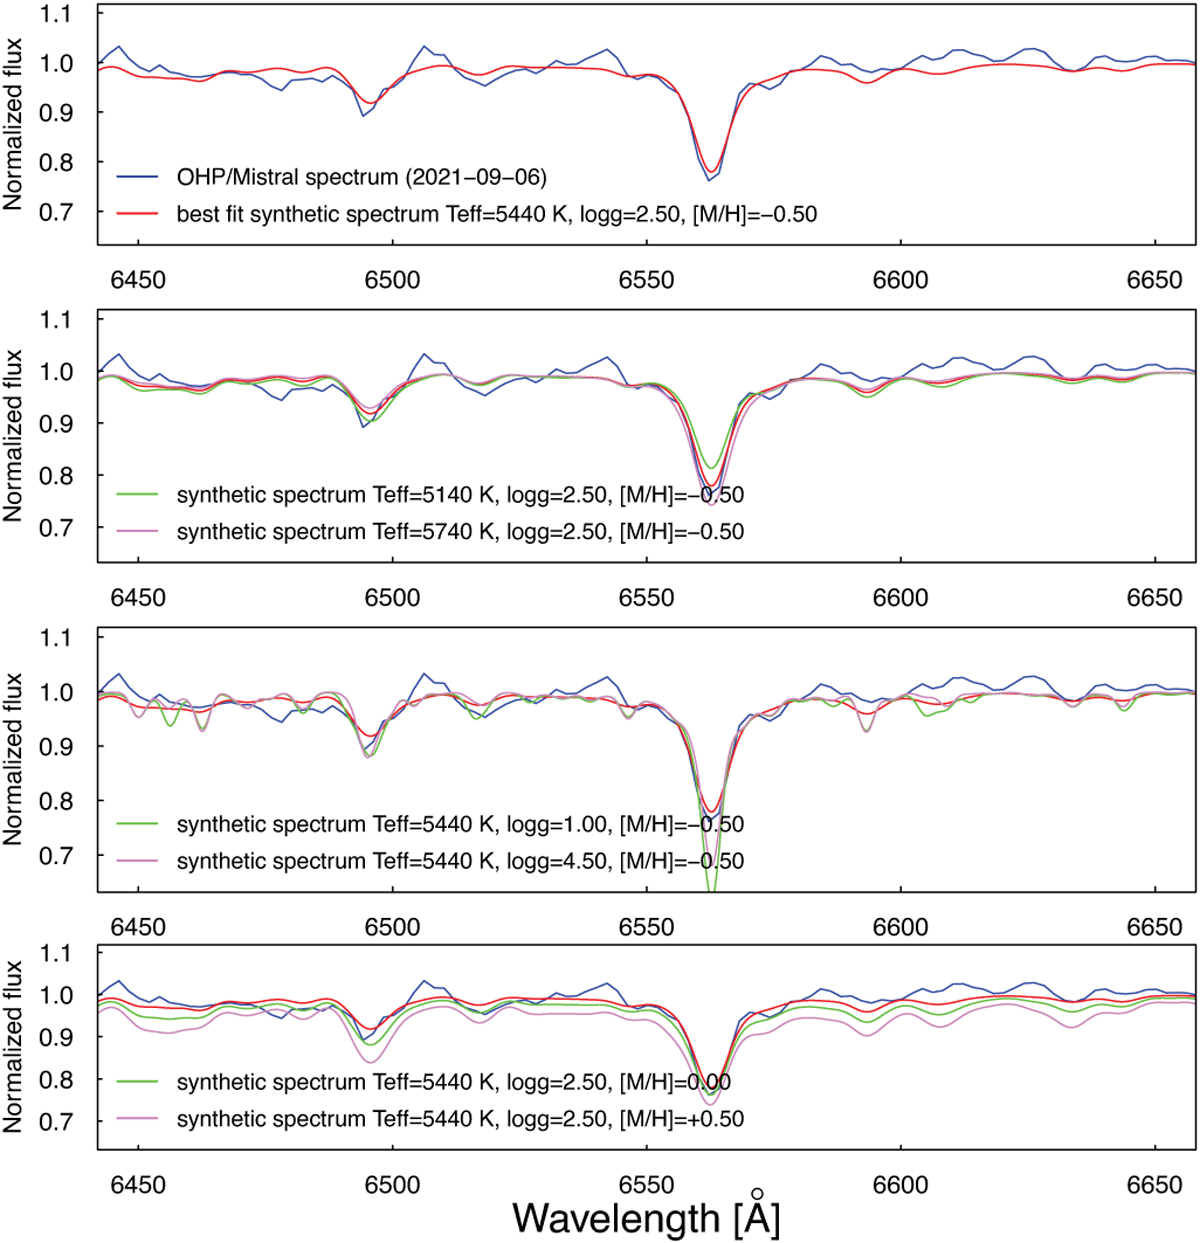
(From top to bottom) OHP/Mistral spectrum (blue) and best-matching synthetic one (red). The same OHP/Mistral data (blue) but with two other synthetic spectra calculated for different Teff (5140 K green, and 5740 K – pink). The same OHP/Mistral data (blue) compared with two other synthetic spectra calculated for different log g (1.00 green, 4.50 – pink). The same OHP/Mistral data (blue) compared with two other synthetic spectra calculated for different [M/H] (0.00 – green, +0.50 – pink). All plots show the same spectral region around the Hα line.
Current usage metrics show cumulative count of Article Views (full-text article views including HTML views, PDF and ePub downloads, according to the available data) and Abstracts Views on Vision4Press platform.
Data correspond to usage on the plateform after 2015. The current usage metrics is available 48-96 hours after online publication and is updated daily on week days.
Initial download of the metrics may take a while.