| Issue |
A&A
Volume 697, May 2025
|
|
|---|---|---|
| Article Number | L11 | |
| Number of page(s) | 8 | |
| Section | Letters to the Editor | |
| DOI | https://doi.org/10.1051/0004-6361/202554170 | |
| Published online | 20 May 2025 | |
Letter to the Editor
Discovery of resonating integration modes in triple-mode high-amplitude δ Scuti stars: A new evolutionary phase indicator
1
Institute of Theoretical Physics, Shanxi University, Taiyuan 030006, China
2
State Key Laboratory of Quantum Optics Technologies and Devices, Shanxi University, Taiyuan 030006, China
3
Collaborative Innovation Center of Extreme Optics, Shanxi University, Taiyuan 030006, China
4
Department of Physics, Taiyuan Normal University, Jinzhong 030619, China
5
Institute of Computational and Applied Physics, Taiyuan Normal University, Jinzhong 030619, China
6
Shanxi Key Laboratory for Intelligent Optimization Computing and Blockchain Technology, Jinzhong 030619, China
⋆ Corresponding author: This email address is being protected from spambots. You need JavaScript enabled to view it.
Received:
18
February
2025
Accepted:
3
May
2025
Abstract
High-amplitude δ Scuti stars (HADS) that pulsate in their first three radial modes are rare in current samples. Here, we analyse five such triple-mode HADS observed by the Transiting Exoplanet Survey Satellite (TESS) and report that the previously considered second overtone mode (f2) is actually the non-radial component of a resonating integration mode (RI mode, resulting from resonance between a radial p-mode and a non-radial p-g mixed mode), which shows significant amplitude and frequency variations over short timescales (approximately 20 days). This RI mode appears to be widespread among these stars. Notably, all five stars are in the post-main sequence evolutionary phase, actively crossing the Hertzsprung gap. These stars offer valuable insights into stellar evolution during the Hertzsprung gap, which is one of the most rapid evolutionary stages in a star’s life.
Key words: methods: data analysis / techniques: photometric / stars: evolution / stars: oscillations / stars: variables: δ Scuti
© The Authors 2025
 Open Access article, published by EDP Sciences, under the terms of the Creative Commons Attribution License (https://creativecommons.org/licenses/by/4.0), which permits unrestricted use, distribution, and reproduction in any medium, provided the original work is properly cited.
This article is published in open access under the Subscribe to Open model. This email address is being protected from spambots. You need JavaScript enabled to view it. to support open access publication.
1. Introduction
δ-pagination Scuti stars are short-period pulsating variable stars with periods ranging from 15 minutes to 8 hours and spectral types A–F. They are located at the intersection of the main sequence (MS) and the lower section of the classical Cepheid instability strip on the Hertzsprung-Russell (H-R) diagram. The pulsations in δ Scuti stars are self-excited via the κ mechanism, driven by partial ionisation of helium in their outer layers (Kallinger et al. 2008; Handler 2009; Guenther et al. 2009; Uytterhoeven et al. 2011; Holdsworth et al. 2014; Steindl et al. 2022).
High-amplitude δ Scuti stars (HADS) are a sub-class characterised by larger amplitudes (ΔV ≥ 0.1 mag) and slower rotation speeds (vsini ≤ 30 km/s). However, as more HADS samples have been accumulated, these classical criteria have become less distinct (Balona et al. 2012). Most HADS pulsate with one or two radial modes (Niu et al. 2013, 2017; Bowman et al. 2021; Daszyńska-Daszkiewicz et al. 2022), while some exhibit three radial modes (Wils et al. 2008; Niu & Xue 2022; Xue et al. 2023), four radial modes (Pietrukowicz et al. 2013; Netzel et al. 2022; Netzel & Smolec 2022), or even non-radial modes (Poretti et al. 2011; Xue & Niu 2020).
To date, only 18 HADS in the Galaxy have been confirmed to pulsate in the first three radial modes – the fundamental mode and the first two overtones (f0, f1, and f2)1 (Xue et al. 2023). With the increasing amount of high-precision photometric data from space telescopes (e.g. Kepler and TESS), unexpected pulsation properties have been discovered in these HADS.
For example, in KIC 6382916, Ulusoy et al. (2013) and Mow et al. (2016) using Kepler long-cadence data found a significant increase in the amplitude of the second overtone mode (f2). Subsequently, Niu & Xue (2022) reported that the linear period variation rate of f2 is about eight times larger than the ones of the first two modes (f0 and f1). Using Kepler short-cadence data, Niu & Xue (2024) found that the harmonics of f0 and f1 exhibit amplitude and frequency variations uncorrelated with their parent modes, even at the first and second harmonics. Furthermore, significant interactions were observed between f2 and its partner mode (−f0 + 2f1).
These unexpected pulsation behaviours can be naturally explained by the framework proposed in Niu & Xue (2022), based on a comprehensive study of KIC 6382916. In this framework, the third pulsation mode (f2) is identified as the non-radial component of a resonating integration (RI) mode, generated by resonance between a radial p-mode and a non-radial p-g mixed mode.
Specifically, the RI mode framework is illustrated in Figure 1: (i) resonance occurs between a radial p-mode ( , the radial second overtone) and a non-radial p-g mixed mode (
 , with n = 2 and l = 1), producing a RI mode (
 , RI mode); (ii)
  , having both radial and non-radial properties, splits into two frequencies (
 with m = 0 and
  with m = 1) due to stellar rotation (
 , where Δω is the stellar rotational frequency); (iii)
  combines with the combination of f0 and f1 (i.e., −f0 + 2f1) to form the observed partner mode of f2; and (iv)
  corresponds to the observed f2. This framework not only explains the long-term amplitude increase and large frequency variation in f2 but also predicts short-term features: (i) f2 may exhibit amplitude or frequency modulation due to the similarity yet difference between
  and
and  ; and (ii) the partner mode of f2 (−f0 + 2f1) may show frequency splitting and asynchronous amplitude or frequency variations compared to f2 due to its dual identity. Both short-term predictions were confirmed in Niu & Xue (2024), using Kepler short-cadence data.
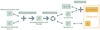 |
Fig. 1. Framework based on the RI mode. The two elements in the orange dotted box represent frequencies directly observed in the frequency domain of light curves. The annotation of the labels are presented in bolded dark font. |
It is now intriguing to investigate whether these phenomena are widespread in other radial triple-mode HADS. In this study, we examine the amplitude and frequency variations in f2 and its partner mode (−f0 + 2f1) in five HADS stars: DO CMi, GSC 06047-00749 (ASAS J094303-1707.3), V0803 Aur, V1384 Tau, and V1393 Cen. These stars were previously identified as radial triple-mode HADS based on TESS space telescope time-series photometric data (Xue et al. 2023).
2. Results
Based on the same methods used in Xue & Niu (2024), we extracted the amplitude and frequency variations in f2 and its partner pulsation mode (−f0 + 2f1) for the five HADS stars, as is shown in Figure 2. In Figure 2, the relative amplitude variations ( )2, the absolute frequency variations (Δf ≡ fmax − fmin)3, and the Pearson correlation coefficient (ρA, f, which represents a perfect correlation or anti-correlation between the variations of the amplitude and frequency when it equals +1 or –1, respectively) between amplitude and frequency are displayed for a more quantitative representation.
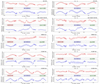 |
Fig. 2. Amplitude and frequency variations in f2 and its partner pulsation mode (−f0 + 2f1) for the five HADS. |

As is illustrated in Figure 2, the amplitude and frequency of f2 and −f0 + 2f1 in all five HADS exhibit significant short-term modulation, with amplitude variations ranging from 14% to 57% and frequency variations from 0.01 to 0.06 c/d within 20 days. Furthermore, the amplitude and frequency variations in f2 and −f0 + 2f1 are asynchronous in these HADS. Considering that they are locked by the rotation of the star (which should show synchronous frequency variations if −f0 + 2f1 were just the rotational splitting of f2), this indicates that the partner pulsation mode of f2 should have a dual identity. None of the amplitude and frequency variations in Figure 2 show obvious (anti-)correlations, except for the f2 of V1393 Cen, which exhibits a similar behaviour to the f2 of KIC 6382916 (Niu & Xue 2024).
3. Discussions and conclusions
It is quite interesting that the framework of the RI mode proposed in Niu & Xue (2022) for KIC 6382916 can also be confirmed in other (previously considered) radial triple-mode HADS, indicating that the RI mode is quite prevalent in such stars. Due to the limited duration of the photometric data in this study, we can only confirm the short-term behaviour of f2. With the accumulation of more photometric data for these HADS, we anticipate that f2 will exhibit continuous amplitude increases or decreases and significant differences in linear period variation rates compared to f0 and f1 over long timescales, similar to the case of KIC 6382916.
Given that the RI mode arises from resonance between a radial p-mode and a non-radial p-g mixed mode (which corresponds to a specific structure), we predict that these stars should be in a specific evolutionary phase. Since f2 is not the second overtone pulsation mode in the RI mode framework and always shows distinct frequency variations in the five HADS, we used f0 and f1 (which are confirmed as the fundamental and first overtone pulsation modes with relatively stable frequencies) to determine the evolutionary phase of these HADS.
As was done in Niu & Xue (2022), the asteroseismological models of the five HADS were constructed using the Modules for Experiments in Stellar Astrophysics (MESA; Paxton et al. 2011, 2013, 2015; Paxton et al. 2018, 2019; Jermyn et al. 2023) and the stellar oscillation code GYRE (Townsend & Teitler 2013; Townsend et al. 2018; Goldstein & Townsend 2020; Sun et al. 2023). All metallicity values (listed in Table 1) are from Gaia DR3 (Anders et al. 2022). Further details of the theoretical calculations can be found in Appendix B.
Information on the best-fit seismic models.
The evolutionary tracks for each of the five HADS were calculated from the pre-MS to the red giant (RG) branch with a mass step of 0.01 M⊙, covering a mass interval of 1 M⊙ (depending on the best-fit models). Based on the pulsation frequencies calculated at each step along the evolutionary tracks, we obtained the best-fit seismic models (with the smallest χ2 values relative to the observed f0 and f1) for the five HADS (see Table 1 for details). The H-R and Petersen diagrams are shown in Figures C.1 and C.2, respectively.
Furthermore, it is noteworthy that all five HADS are located in the post-MS evolutionary phase, with helium cores and hydrogen-burning shells, actively crossing the Hertzsprung Gap. This finding aligns with our prediction and suggests that the (previously considered) radial triple-mode HADS should be in a special evolutionary phase, in which f2 is no longer the radial second overtone pulsation mode but the non-radial component of the RI mode.
Generally, HADS are considered to be in MS and post-MS evolutionary phases. However, confirming the evolutionary phase of a single HADS via asteroseismology is challenging. In recent years, the evolutionary phases of some radial double-mode HADS have been confirmed using asteroseismology, including the MS phase (Bowman et al. 2021; Chen et al. 2025) and post-MS phase (which can be divided into the overall contraction phase (Daszyńska-Daszkiewicz et al. 2022, 2023) and hydrogen-burning shell phase (Niu et al. 2017; Xue et al. 2018, 2022; Daszyńska-Daszkiewicz et al. 2023, 2024 in detail).
Figure C.3 presents the radial displacement (represented by rρ1/2δr) of the related pulsation modes (the second overtone and the p-g mixed mode) and some relevant profiles (including the sound speed (csound), opacity, convection velocity (convection), and hydrogen and helium fractions (H fraction and He fraction)) of the best-fit seismic models for the five HADS. The radial displacement of the second overtone and the p-g mixed modes show close nodes and similar phases along with the radius in the outer layers, which provides a necessary condition for resonance. The hydrogen and helium profiles and the convection region indicate that the star has a helium core, left the MS, and entered the post-MS evolutionary phase. All the sound speed profiles of the five stars show a similar structure near the core region, jumping near the edges of the cores and then beginning to decrease steadily. Considering that the convection region will extend into the deeper region of the stars and the κ mechanism will be suppressed in the RG phase, we could conclude that these type of HADS are located in a transition phase with a hydrogen burning shell before the RG phase. Based on this work and Niu & Xue (2022), we can expect that the (previously considered) radial triple-mode HADS are in the post-MS phase with helium cores and hydrogen-burning shells.
In summary, all five (previously considered) radial triple-mode HADS studied in this work exhibit a distinct amplitude and frequency modulation in f2, which was previously considered the second overtone pulsation mode but is now identified as the non-radial component of an RI mode. It appears that the RI mode is a common phenomenon in these triple-mode HADS. Moreover, all these triple-mode HADS are located in the post-MS evolutionary phase, crossing the Hertzsprung Gap, which reveals interesting relationships between their pulsation behaviours and evolutionary properties. Although whether all (previously considered) radial triple-mode HADS are in the same evolutionary phase (post-MS) requires further confirmation, the confirmed cases (KIC 6382916 (Niu & Xue 2022) and the five HADS in this work) provide excellent samples for studying stellar evolution in the Hertzsprung Gap, one of the most rapidly evolving stages in a star’s life.
Pulsation mode identifications were based on period ratio relations (Stellingwerf 1979).
Here, Amax and Amin represent the maximum and minimum amplitude values within the moving windows, while  denotes the mean amplitude across these windows.
fmax and fmin correspond to the maximum and minimum frequency values observed within the moving windows.
Acknowledgments
We would like to thank Jue-Ran Niu for providing us with an efficient working environment. H.F.X. acknowledges support from the National Natural Science Foundation of China (NSFC) (No. 12303036). The authors acknowledge the TESS Science team and everyone who has contributed to making the TESS mission possible.
References
- Anders, F., Khalatyan, A., Queiroz, A. B. A., et al. 2022, A&A, 658, A91 [NASA ADS] [CrossRef] [EDP Sciences] [Google Scholar]
- Asplund, M., Grevesse, N., Sauval, A. J., & Scott, P. 2009, ARA&A, 47, 481 [NASA ADS] [CrossRef] [Google Scholar]
- Balona, L. A., Lenz, P., Antoci, V., et al. 2012, MNRAS, 419, 3028 [NASA ADS] [CrossRef] [Google Scholar]
- Bowman, D. M., Hermans, J., Daszyńska-Daszkiewicz, J., et al. 2021, MNRAS, 504, 4039 [NASA ADS] [CrossRef] [Google Scholar]
- Chen, X., Zhang, X., & Li, Y. 2025, MNRAS, 536, 1778 [Google Scholar]
- Daszyńska-Daszkiewicz, J., Walczak, P., Pamyatnykh, A. A., & Szewczuk, W. 2022, MNRAS, 512, 3551 [CrossRef] [Google Scholar]
- Daszyńska-Daszkiewicz, J., Walczak, P., Szewczuk, W., & Niewiadomski, W. 2023, MNRAS, 526, 1951 [Google Scholar]
- Daszyńska-Daszkiewicz, J., Szewczuk, W., & Walczak, P. 2024, MNRAS, 532, 1140 [Google Scholar]
- Goldstein, J., & Townsend, R. H. D. 2020, ApJ, 899, 116 [NASA ADS] [CrossRef] [Google Scholar]
- Guenther, D. B., Kallinger, T., Zwintz, K., et al. 2009, ApJ, 704, 1710 [NASA ADS] [CrossRef] [Google Scholar]
- Handler, G. 2009, in Stellar Pulsation: Challenges for Theory and Observation, eds. J. A. Guzik & P. A. Bradley, American Institute of Physics Conference Series, 1170, 403 [NASA ADS] [CrossRef] [Google Scholar]
- Herwig, F. 2000, A&A, 360, 952 [NASA ADS] [Google Scholar]
- Holdsworth, D. L., Smalley, B., Gillon, M., et al. 2014, MNRAS, 439, 2078 [NASA ADS] [CrossRef] [Google Scholar]
- Jermyn, A. S., Bauer, E. B., Schwab, J., et al. 2023, ApJS, 265, 15 [NASA ADS] [CrossRef] [Google Scholar]
- Kallinger, T., Zwintz, K., & Weiss, W. 2008, A&A, 488, 279 [NASA ADS] [CrossRef] [EDP Sciences] [Google Scholar]
- Magic, Z., Serenelli, A., Weiss, A., & Chaboyer, B. 2010, ApJ, 718, 1378 [NASA ADS] [CrossRef] [Google Scholar]
- Mow, B., Reinhart, E., Nhim, S., & Watkins, R. 2016, AJ, 152, 17 [NASA ADS] [CrossRef] [Google Scholar]
- Mowlavi, N., Meynet, G., Maeder, A., Schaerer, D., & Charbonnel, C. 1998, A&A, 335, 573 [NASA ADS] [Google Scholar]
- Netzel, H., & Smolec, R. 2022, MNRAS, 515, 4574 [NASA ADS] [CrossRef] [Google Scholar]
- Netzel, H., Pietrukowicz, P., Soszyński, I., & Wrona, M. 2022, MNRAS, 510, 1748 [Google Scholar]
- Niu, J.-S., & Xue, H.-F. 2022, ApJ, 938, L20 [NASA ADS] [CrossRef] [Google Scholar]
- Niu, J.-S., & Xue, H.-F. 2024, A&A, 628, L8 [NASA ADS] [CrossRef] [EDP Sciences] [Google Scholar]
- Niu, J.-S., Fu, J.-N., & Zong, W.-K. 2013, RAA, 13, 1181 [NASA ADS] [Google Scholar]
- Niu, J.-S., Fu, J.-N., Li, Y., et al. 2017, MNRAS, 467, 3122 [NASA ADS] [Google Scholar]
- Paxton, B., Bildsten, L., Dotter, A., et al. 2011, ApJS, 192, 3 [Google Scholar]
- Paxton, B., Cantiello, M., Arras, P., et al. 2013, ApJS, 208, 4 [Google Scholar]
- Paxton, B., Marchant, P., Schwab, J., et al. 2015, ApJS, 220, 15 [Google Scholar]
- Paxton, B., Schwab, J., Bauer, E. B., et al. 2018, ApJS, 234, 34 [NASA ADS] [CrossRef] [Google Scholar]
- Paxton, B., Smolec, R., Schwab, J., et al. 2019, ApJS, 243, 10 [Google Scholar]
- Pietrukowicz, P., Dziembowski, W. A., Mróz, P., et al. 2013, Acta Astron., 63, 379 [Google Scholar]
- Poretti, E., Rainer, M., Weiss, W. W., et al. 2011, A&A, 528, A147 [NASA ADS] [CrossRef] [EDP Sciences] [Google Scholar]
- Steindl, T., Zwintz, K., & Vorobyov, E. 2022, Nat. Commun., 13, 5355 [NASA ADS] [CrossRef] [Google Scholar]
- Stellingwerf, R. F. 1979, ApJ, 227, 935 [NASA ADS] [CrossRef] [Google Scholar]
- Sun, M., Townsend, R. H. D., & Guo, Z. 2023, ApJ, 945, 43 [NASA ADS] [CrossRef] [Google Scholar]
- Townsend, R. H. D., & Teitler, S. A. 2013, MNRAS, 435, 3406 [Google Scholar]
- Townsend, R. H. D., Goldstein, J., & Zweibel, E. G. 2018, MNRAS, 475, 879 [Google Scholar]
- Ulusoy, C., Ulaş, B., Gülmez, T., et al. 2013, MNRAS, 433, 394 [NASA ADS] [CrossRef] [Google Scholar]
- Uytterhoeven, K., Moya, A., Grigahcène, A., et al. 2011, A&A, 534, A125 [CrossRef] [EDP Sciences] [Google Scholar]
- Wils, P., Rozakis, I., Kleidis, S., Hambsch, F. J., & Bernhard, K. 2008, A&A, 478, 865 [NASA ADS] [CrossRef] [EDP Sciences] [Google Scholar]
- Xue, H.-F., & Niu, J.-S. 2020, ApJ, 904, 5 [NASA ADS] [CrossRef] [Google Scholar]
- Xue, H.-F., & Niu, J.-S. 2024, A&A, 687, L15 [NASA ADS] [CrossRef] [EDP Sciences] [Google Scholar]
- Xue, H.-F., Fu, J.-N., Fox-Machado, L., et al. 2018, ApJ, 861, 96 [NASA ADS] [CrossRef] [Google Scholar]
- Xue, H.-F., Niu, J.-S., & Fu, J.-N. 2022, RAA, 22, 105006 [NASA ADS] [Google Scholar]
- Xue, W., Niu, J.-S., Xue, H.-F., & Yin, S. 2023, RAA, 23, 075002 [NASA ADS] [Google Scholar]
Appendix A: Overview of the important frequencies and data of the five stars
Fourier analysis was applied to the light curves, and the amplitudes and frequencies of f0, f1, and f2 are presented in Table A.1.
Amplitudes and frequencies of the f0, f1, and f2 pulsation mode of the five HADS.
Appendix B: Theoretical model calculation
In order to determine the stellar mass and evolutionary phase based on the single star evolutionary models, the open source 1D stellar evolution code Modules for Experiments in Stellar Astrophysics (MESA, r24.08.1, Paxton et al. (2011, 2013, 2015, 2018, 2019), Jermyn et al. (2023)) was used to construct the structural and evolutionary models. At each step along with the evolutionary tracks, the pulsation frequencies of the specific structure were calculated by the stellar oscillation code GYRE (Townsend & Teitler 2013; Townsend et al. 2018; Goldstein & Townsend 2020; Sun et al. 2023). All metallicity values (listed in Table 1) are from Gaia DR3 (Anders et al. 2022).
The following formulas were used to calculate the initial heavy element abundance Z, initial hydrogen abundance X, and the helium abundance Y:
![Mathematical equation: $$ \begin{aligned}&\mathrm{[Fe/H]} = \log \frac{Z}{X} - \log \frac{Z_\odot }{X_\odot },\end{aligned} $$](/articles/aa/full_html/2025/05/aa54170-25/aa54170-25-eq15.gif) (B.1)
(B.1)
 (B.2)
(B.2)
 (B.3)
(B.3)
where X⊙ = 0.7381 and Z⊙ = 0.0134 (Asplund et al. 2009). Eq.(B.2) was provided by Mowlavi et al. (1998).
At the same time, the values of the option Zbase (which provides the reference metallicity necessary to calculate element variations) were set to be the initial metallicity of the stars, and initial_zfracs = ’AGSS09_zfracs’ was selected. For the opacity, kap_file_prefix = ’a09’, kap_CO_prefix = ’a09_co’ and kap_lowT_prefix = ’lowT_fa05_a09p’ were selected.
The the mixing-length parameter αMLT = 1.89 (Niu et al. 2017; Niu & Xue 2022; Xue et al. 2023) was used all through this work; the exponential scheme overshooting (Herwig 2000) whose parameter depends on the stellar mass M (in solar masses): fov = (0.13M − 0.098)/9.0 (Magic et al. 2010)) was adopted from pre-MS to post-MS with a mass step of 0.01 M⊙ covering a mass interval of 1 M⊙ (depending on the best-fit models).
The rotation of the star was not considered in the model calculation, because of the relative slow rotation of the star (Δω < 0.3 c/d). All the evolutionary tracks were calculated from the pre-MS to the RG branch.
Based on the pulsation frequencies calculated in every step along with the evolutionary tracks, we got the best-fit seismic models (which have the smallest χ2 with respect to the observed values of f0 and f1) for all the five stars (see in Table 1 for detailed information). The H-R diagram and Petersen diagram are shown in Figure C.1 and Figure C.2, respectively.
Appendix C: Figures
The H-R and Petersen diagrams with all evolutionary tracks and best-fit seismic models of the five HADS are shown in Figures C.1 and C.2, respectively. The radial displacement (represented by rρ1/2δr) of the related pulsation modes (the second overtone and the p-g mixed mode) and some relevant profiles (including the sound speed (csound), opacity, convection velocity (convection), hydrogen and helium fractions (H fraction and He fraction)) of the best-fit seismic models are shown in Figure C.3.
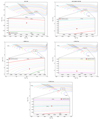 |
Fig. C.1. Hertzsprung-Russell diagram with all the evolutionary tracks and the best-fit seismic models of the five HADS. The coloured solid evolutionary tracks show the stages from the zero-age main sequence (ZAMS) to the post-main sequence (post-MS) evolutionary phase, with initial masses covering 1 M⊙. The regions surrounded by the black rectangular boxes are zoomed-in views of the best-fit seismic models, represented by red stars. The coloured dashed lines indicate evolutionary tracks with initial mass steps of 0.01 M⊙. |
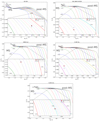 |
Fig. C.2. Petersen diagram with all evolutionary tracks and best-fit seismic models of the five HADS. The coloured solid evolutionary tracks show the stages from the zero-age MS to the post-MS evolutionary phase, with initial masses covering 1 M⊙. The regions surrounded by the black rectangular boxes are selected to zoom in the best-fit seismic models, which are represented by the red stars. The coloured dashed lines present the evolutionary tracks with initial mass steps of 0.01 M⊙. |
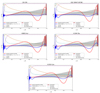 |
Fig. C.3. Radial displacement (represented by rρ1/2δr) of the related pulsation modes and some relevant profiles of the best-fit seismic models. Note that all the profiles are renormalized for a better presentation. |
All Tables
Amplitudes and frequencies of the f0, f1, and f2 pulsation mode of the five HADS.
All Figures
|
Fig. 1. Framework based on the RI mode. The two elements in the orange dotted box represent frequencies directly observed in the frequency domain of light curves. The annotation of the labels are presented in bolded dark font. |
| In the text | |
|
Fig. 2. Amplitude and frequency variations in f2 and its partner pulsation mode (−f0 + 2f1) for the five HADS. |
| In the text | |
|
Fig. C.1. Hertzsprung-Russell diagram with all the evolutionary tracks and the best-fit seismic models of the five HADS. The coloured solid evolutionary tracks show the stages from the zero-age main sequence (ZAMS) to the post-main sequence (post-MS) evolutionary phase, with initial masses covering 1 M⊙. The regions surrounded by the black rectangular boxes are zoomed-in views of the best-fit seismic models, represented by red stars. The coloured dashed lines indicate evolutionary tracks with initial mass steps of 0.01 M⊙. |
| In the text | |
|
Fig. C.2. Petersen diagram with all evolutionary tracks and best-fit seismic models of the five HADS. The coloured solid evolutionary tracks show the stages from the zero-age MS to the post-MS evolutionary phase, with initial masses covering 1 M⊙. The regions surrounded by the black rectangular boxes are selected to zoom in the best-fit seismic models, which are represented by the red stars. The coloured dashed lines present the evolutionary tracks with initial mass steps of 0.01 M⊙. |
| In the text | |
|
Fig. C.3. Radial displacement (represented by rρ1/2δr) of the related pulsation modes and some relevant profiles of the best-fit seismic models. Note that all the profiles are renormalized for a better presentation. |
| In the text | |
Current usage metrics show cumulative count of Article Views (full-text article views including HTML views, PDF and ePub downloads, according to the available data) and Abstracts Views on Vision4Press platform.
Data correspond to usage on the plateform after 2015. The current usage metrics is available 48-96 hours after online publication and is updated daily on week days.
Initial download of the metrics may take a while.