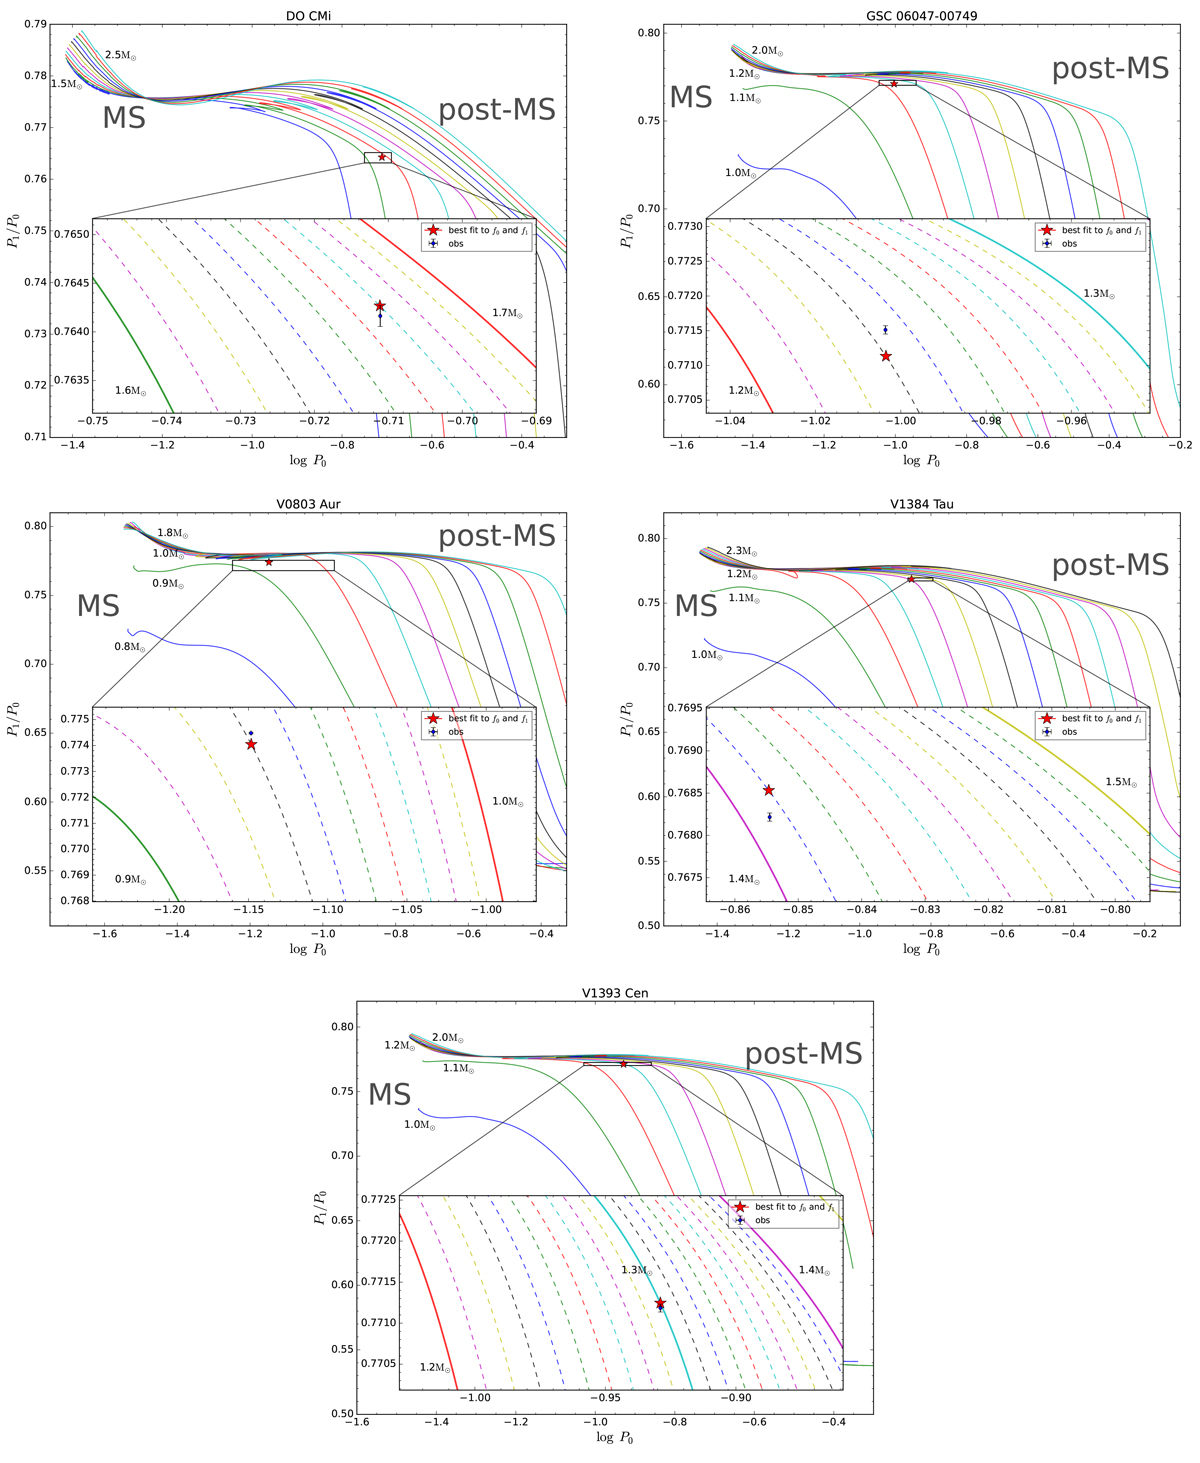
Fig. C.2.
Download original image
Petersen diagram with all evolutionary tracks and best-fit seismic models of the five HADS. The coloured solid evolutionary tracks show the stages from the zero-age MS to the post-MS evolutionary phase, with initial masses covering 1 M⊙. The regions surrounded by the black rectangular boxes are selected to zoom in the best-fit seismic models, which are represented by the red stars. The coloured dashed lines present the evolutionary tracks with initial mass steps of 0.01 M⊙.
Current usage metrics show cumulative count of Article Views (full-text article views including HTML views, PDF and ePub downloads, according to the available data) and Abstracts Views on Vision4Press platform.
Data correspond to usage on the plateform after 2015. The current usage metrics is available 48-96 hours after online publication and is updated daily on week days.
Initial download of the metrics may take a while.