| Issue |
A&A
Volume 682, February 2024
|
|
|---|---|---|
| Article Number | L8 | |
| Number of page(s) | 13 | |
| Section | Letters to the Editor | |
| DOI | https://doi.org/10.1051/0004-6361/202348757 | |
| Published online | 09 February 2024 | |
Letter to the Editor
Unveiling the intricate symphony of nonlinear pulsation mode interactions in high-amplitude δ Scuti stars
1
Institute of Theoretical Physics, Shanxi University, Taiyuan 030006, PR China
e-mail: This email address is being protected from spambots. You need JavaScript enabled to view it.
2
State Key Laboratory of Quantum Optics and Quantum Optics Devices, Shanxi University, Taiyuan 030006, PR China
3
Collaborative Innovation Center of Extreme Optics, Shanxi University, Taiyuan 030006, PR China
4
Department of Physics, Taiyuan Normal University, Jinzhong 030619, PR China
e-mail: This email address is being protected from spambots. You need JavaScript enabled to view it.
5
Institute of Computational and Applied Physics, Taiyuan Normal University, Jinzhong 030619, PR China
Received:
28
November
2023
Accepted:
20
January
2024
Abstract
Information on the interiors of stars can be gleaned from their pulsations. Pulsation modes, which are determined by the internal state and structure of a star, are typically considered stable over short timescales. These independent pulsation modes have been used in asteroseismology to determine the interior structures of stars. Here, we report the discovery of peculiar pulsation mode interactions in the high-amplitude δ Scuti star KIC 6382916 (J19480292+4146558) that challenge the reliability of independent pulsation modes as indicators of a star’s internal structure. Through analysis of archival data, we find distinct variations in the amplitudes and frequencies of three independent pulsation modes and their harmonics and combinations over approximately 20 days. These variations can reach amplitudes of about 140% and frequency variations of about 12%. Correlation analysis of amplitude and frequency variations reveal additional pulsation mode interaction details and patterns. Notably, our findings regarding the phenomena related to the harmonics of independent pulsation modes challenge the traditional understanding in this area. These discoveries serve as cornerstones for future research and advance nonlinear asteroseismology.
Key words: stars: evolution / stars: oscillations / stars: variables: δ Scuti
© The Authors 2024
 Open Access article, published by EDP Sciences, under the terms of the Creative Commons Attribution License (https://creativecommons.org/licenses/by/4.0), which permits unrestricted use, distribution, and reproduction in any medium, provided the original work is properly cited.
This article is published in open access under the Subscribe to Open model. This email address is being protected from spambots. You need JavaScript enabled to view it. to support open access publication.
1. Introduction
Delta Scuti stars belong to the class of short-period pulsating variable stars, with periods ranging from 15 min to 8 h and spectral classes A–F. They can be found at the intersection of the main sequence and the lower section of the classical Cepheid instability strip on the Hertzsprung–Russell diagram. The pulsations in δ Scuti stars are self-excited by the κ mechanism, which arises from the partial ionization of helium in the outer layers (Kallinger et al. 2008; Handler 2009; Guenther et al. 2009; Uytterhoeven et al. 2011; Holdsworth et al. 2014; Steindl et al. 2022).
High-amplitude δ Scuti stars (HADSs) constitute a subclass of δ Scuti stars with relatively large amplitudes ( ) and slow rotation speeds (v sin i ≤ 30 km s−1) in most cases. However, as more samples of HADSs have been accumulated, these classical criteria have become less clear (see, e.g., Balona et al. 2012). Most HADSs pulsate with one or two radial pulsation modes (Niu et al. 2013, 2017; Bowman et al. 2021; Daszyńska-Daszkiewicz et al. 2022), though some exhibit three (Wils et al. 2008; Niu & Xue 2022; Xue et al. 2023) or four radial pulsation modes (Pietrukowicz et al. 2013; Netzel et al. 2022; Netzel & Smolec 2022), or even non-radial pulsation modes (Poretti et al. 2011; Xue & Niu 2020).
For a long time, the stability of the amplitudes and frequencies of HADSs has been assumed based on the limited quality of observational data. However, recent advancements in continuous time-series photometric data from space telescopes, such as Kepler and Transiting Exoplanet Survey Satellite (TESS), have presented an opportunity to explore variations in pulsation modes over several years. The analysis of high-quality data has revealed pulsation mode variations (including in terms of amplitudes, frequencies, and phases) in various types of stars, including RR Lyrae stars (Carrell et al. 2021), δ Scuti stars (Murphy et al. 2012; Breger & Montgomery 2014; Bowman et al. 2016), pulsating hot B subdwarf stars (Zong et al. 2016a, 2018), pulsating DB white dwarf stars (Zong et al. 2016b), and slowly pulsating B stars (Van Beeck et al. 2021). These variations not only provide additional information that helps us understand pulsation modes themselves (such as the excitation and selection mechanisms and the mode interactions), but also shed light on stellar structures and evolution. Despite HADSs primarily pulsating in low-order radial p-modes (fundamental, first overtone, or second overtone modes), their pulsation modes also exhibit distinct variations over several years. Furthermore, the determinations of linear period variation rates (Bowman et al. 2021; Niu & Xue 2022) and even quadratic amplitude variation rates (Niu & Xue 2022) from these photometric data allow us to improve current stellar evolution and pulsation theories.
KIC 6382916 (J19480292+4146558), also known as GSC 03144-595, is a HADS that was extensively monitored by the Kepler space telescope. The light curves of this star show three independent pulsation modes. Initially, these three modes were identified as non-radial pulsation modes with l = 1 by Ulusoy et al. (2013). Later, Mow et al. (2016) determined that these modes are actually the fundamental, first overtone, and second overtone radial p-modes. Recently, Niu & Xue (2022) conducted a comprehensive study on the pulsation mode variations of KIC 6382916 over a period of about 4 yr. Through a comparison between observations and theoretical calculations, they identified the first and second pulsation modes (f0 and f1) as the fundamental and first overtone modes, respectively. The third pulsation mode (f2) was found to be the non-radial part of a resonating integration (RI) mode, generated by the resonance between a radial p-mode and a non-radial p–g mixed mode. Furthermore, Niu & Xue (2022) discovered that almost all the f2-related combinations have partners with frequencies approximately Δω = 0.0815 c/d away from them in the frequency domain. These pairs follow the frequency relation f2 − Δω = 2f1 − f0.
In this study we extracted the same pulsation modes as Niu & Xue (2022) using the short-cadence (SC) photometric data of KIC 6382916 from the Kepler telescope, obtained from barycentric Julian day (BJD) 2455064 to 2455091 (Quarter 02). We aimed to study the variations and interactions of these modes on a short timescale. Table 1 presents the frequencies and amplitudes of the 23 selected pulsation modes, as well as their absolute and relative variations (ΔA,  , Δf, and
  ) and the Pearson correlation coefficients (ρA, f). We were able to extract variation information from the light curves for 19 of these pulsation modes. Further details can be found in the Appendix.
Overall indicators of the 23 pulsation modes.
2. Results and discussions
2.1. Resonating integration mode
Based on the proposed framework of the RI mode laid out in Niu & Xue (2022), we predicted two important behaviors on short timescales for the pulsation modes F5 (f2) and F8 (−f0 + 2f1): (i) as the non-radial part of a RI mode, F5 should exhibit amplitude and frequency modulations; and (ii) as the superposition and resonance of the radial part of a RI mode and the combination of f0 and f1, F8 should have a dual identity and exhibit frequency splitting while also being modulated (if two parts of it are out of sync).
Figure 1 presents the amplitude and frequency variations, as well as the interaction details of F5 and F8. Panels a and b show that F5 and F8 exhibit distinct amplitude and frequency modulations, as predicted. Panel c shows that F8 splits into two parts after approximately 235 days. The first part, whose frequency increases after these 235 days, approaches and resonates with F5 (whose frequency decreases). The second part, whose frequency decreases after these 235 days (same as F5, because it is the radial part of the RI mode that generates F5), seems to approach and resonate with another pulsation mode (−4f0 + 3f1 + f2 ≃ 7.69171 c/d)1. After about 246 days, these two parts of F8 merge, and the amplitude of F5 remains low due to decoupling from the first part of F8. However, for F8, its amplitude is not completely anticorrelated with F5, as is evident from the pit between 246 and 249 days. This indicates that the first part of F8 has its own modulation rhythm, independent of F5, which arises from f0 and f1. Furthermore, in panels a and b, the amplitude and frequency fluctuations of F5 (at about 241–242 days) and F8 (at about 240–243 days) are caused by strong resonant interactions with adjacent pulsation modes, making it difficult to accurately distinguish them in these time periods2.
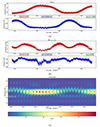 |
Fig. 1. Variation in the amplitudes and frequencies of F5 and its partner, F8. Panel a: Amplitude and frequency variations of F5. Panel b: Amplitude and frequency variations of F8. Panel c: Time-frequency diagram, which presents interaction details in 7.5 − 8.5 c/d. |
In Figs. E.1–E.4, we see that the amplitudes and frequencies of many pulsation modes exhibit strong (anti)correlations. Specifically, the pulsation modes F3, F5, F6, F9, F10, F19, and F20 show significant (anti)correlations, with their |ρA, f| values, exceeding 9.0. The amplitude and frequency (anti)correlations of these modes can be consistently explained by the framework provided by F5 and F8. The intrinsic frequency modulation of these modes leads to resonances between these modes and their partners. These resonances result in the growth of amplitudes. Although the modulation in frequency leads to the modulation in amplitude in general, it presents another problem that needs to be addressed, which comes from the non-correlation of the frequencies and their harmonics.
2.2. Harmonics and combinations
In pulsating stars, such as Cepheids (Rathour et al. 2021), RR Lyrae stars (Kurtz et al. 2016), δ Scuti stars (Breger & Montgomery 2014), HADSs (Niu et al. 2017), SX Phoenicis stars (Xue & Niu 2020), γ Dor stars (Kurtz et al. 2015), pulsating white dwarfs (Wu 2001), β Cep stars (Degroote et al. 2009), and slowly pulsating B stars (Pápics et al. 2017), harmonics of independent pulsation modes are quite common. These harmonics arise from the non-sinusoidal nature of light curves and indicate the nonlinearity of the star’s pulsation. Therefore, harmonics are not considered intrinsic stellar pulsation modes (Brickhill 1992; Wu 2001) and they should mimic the behaviors of their parent pulsation modes. However, recent research has shown that as the order of the harmonics increases, the amplitude and frequency of the harmonics exhibit variations that are uncorrelated with their parent pulsation mode (Niu et al. 2023).
For KIC 6382916, the amplitude and frequency variations in the fundamental and first overtone pulsation modes (f0 and f1) are presented in Figs. A.1 and A.2 along with their first and second harmonics (2f0, 3f0, 2f1, and 3f1). It is evident that the harmonics of f0 and f1 show amplitude and frequency variations that are uncorrelated with their parent modes, even at the first and second harmonics. This challenges the common understanding derived from stellar pulsation theory, thus broadening our perception of harmonics.
Furthermore, the amplitude and frequency variations in 2f1 and 3f1 exhibit a high degree of correlation, indicating that 2f1 behaves like an independent parent pulsation mode of 3f1. In general, the pulsation mode 3f1 can be represented by 3 ⋅ (f1) and (2f1)+(f1), which are equivalent representations. However, in this case, the correct representation of 3f1 is (2f1)+(f1). This challenges the usual frequency identification of harmonics in the pre-whitening process and subsequently the identification of independent pulsation modes. Moreover, if we adhere to the principle that frequency modulation leads to the amplitude modulation and explain amplitude modulations through resonances, the physical origin of the frequency modulation in 2f1 becomes an unknown. It should be noted that (unlike 2f1) f1 does not exhibit obvious frequency modulation.
The aforementioned case is not unique. The pulsation modes F10 (f0 + 2f1) and F20 (f0 + 3f1) also exhibit highly correlated amplitude and frequency variations. This suggests that f0 + 3f1 can be represented as the sum of (f0 + 2f1) and (f1), and that f0 + 2f1 should be considered an independent parent pulsation mode of f0 + 3f1.
2.3. Overview of the interactions
The interactions between the pulsation modes are clearly represented in the amplitude and frequency interaction diagrams of the 19 pulsation modes shown in Fig. 2. These diagrams cluster together pulsation modes with similar amplitude and frequency variation patterns. It is worth noting that these interactions are complex, indicating that the harmonics and combinations are more intricate than commonly assumed, and they contain rich information about the nonlinear characteristics. Furthermore, the resulting interaction relationships differ from those observed over longer timescales (over a period of about 4 yr). Within the interaction diagrams, only F6–F19 and F10–F20 exhibit the most similar behaviors in terms of both amplitude and frequency variations. This observation provides valuable insights that allow us to reevaluate the physical nature of the harmonics and combinations, as discussed earlier.
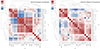 |
Fig. 2. Interaction diagrams of the amplitudes and frequencies of the 19 pulsation modes. |
In the interaction diagram of amplitudes, although the modes related to f2 (F5, F11, F13, and F18) are not clustered together as observed previously in Niu & Xue (2022), they exhibit anticorrelated behavior with the modes in the first cluster (F7, F12, F8, F6, and F19). This suggests an energy transfer between the f2-related modes and some f1-related modes. Specifically, if we consider F7 (2f0 + f1) and F12 (2f0 + 2f1) to be (2f0 − f1)+(2f1) and (2f0 − f1)+(3f1), respectively3, we can observe that the modes in the first cluster are all related to 2f1 and 3f1. Based on the relation 3f1 ≡ (2f1)+(f1), it is evident that the most significant energy transfer channel of the first cluster is 2f1 rather than f1.
In the interaction diagram of frequencies, it can be observed that F3 and F2 exhibit the strongest interactions with other pulsation modes. F3 (−f0 + f1) has the largest number of anticorrelated pulsation modes. On the other hand, F2 (f0 + f1) is anticorrelated with F0 (f0), F1 (f1), and F7 (2f0 + f1), which is quite strange if we note that the first two are the parent modes of F2. This finding challenges our traditional understanding of combination modes in pulsating stars, suggesting the presence of an undiscovered mechanism at play when these modes combine.
The frequency anticorrelation between F0 (f0) and F2 (f0 + f1) is particularly noteworthy. Almost all pulsation modes are affected by a small frequency modulation of approximately 0.004 c/d, as is evident in F0 and F2. This modulation exhibits a period of 0.6570 day and appears to be the background in the time-frequency diagram (see, e.g., Fig. E.5). The physical origin of this modulation is still unknown.
2.4. Summary
In summary, a comprehensive analysis of the pulsation modes in KIC 6382916 reveals a striking analogy to the surface of the sea. On larger timescales (over a period of about 4 yr), the pulsation modes exhibit a seemingly gradual trend. However, when observed on smaller timescales (over a period of about 20 days), they undergo violent fluctuations, with intricate pulsation mode interactions. These interactions manifest as amplitude and frequency modulations, with certain modes presenting a dual identity; this poses challenges to conventional concepts such as harmonics and combinations. Despite the complexity inherent to these phenomena, discernible patterns emerge, offering valuable guidance for future research in nonlinear asteroseismology. This profound understanding of the pulsation modes in KIC 6382916 provides a foundation for unraveling the mysteries of stellar pulsation and opens up exciting avenues for further exploration in the field.
This pulsation mode is not studied in detail because of its low S/N.
The amplitude and frequency variations in F14, F15, F16, and F22 could not be extracted for the same reason. In the lower frequency region, there are more pulsation modes and complex interactions (see Fig. E.5).
This decomposition is inspired by the relationship between 2f1 and 3f1.
Acknowledgments
We would like to thank Jue-Ran Niu for providing us with an efficient working environment. J.S.N. acknowledges support from the National Natural Science Foundation of China (NSFC) (No. 12005124 and No. 12147215). H.F.X. acknowledges support from the National Natural Science Foundation of China (NSFC) (No. 12303036) and the Applied Basic Research Programs of Natural Science Foundation of Shanxi Province (No. 202103021223320). The authors acknowledge the Kepler Science team and everyone who has contributed to making the Kepler mission possible. Funding for the Kepler mission is provided by NASA’s Science Mission Directorate.
References
- Balona, L. A., Lenz, P., Antoci, V., et al. 2012, MNRAS, 419, 3028 [NASA ADS] [CrossRef] [Google Scholar]
- Bowman, D. M., Kurtz, D. W., Breger, M., Murphy, S. J., & Holdsworth, D. L. 2016, MNRAS, 460, 1970 [NASA ADS] [CrossRef] [Google Scholar]
- Bowman, D. M., Hermans, J., Daszyńska-Daszkiewicz, J., et al. 2021, MNRAS, 504, 4039 [NASA ADS] [CrossRef] [Google Scholar]
- Breger, M., & Montgomery, M. H. 2014, ApJ, 783, 89 [NASA ADS] [CrossRef] [Google Scholar]
- Brickhill, A. J. 1992, MNRAS, 259, 519 [CrossRef] [Google Scholar]
- Carrell, K., Wilhelm, R., Olsen, F., et al. 2021, ApJ, 916, L12 [NASA ADS] [CrossRef] [Google Scholar]
- Daszyńska-Daszkiewicz, J., Walczak, P., Pamyatnykh, A. A., & Szewczuk, W. 2022, MNRAS, 512, 3551 [CrossRef] [Google Scholar]
- Degroote, P., Briquet, M., Catala, C., et al. 2009, A&A, 506, 111 [NASA ADS] [CrossRef] [EDP Sciences] [Google Scholar]
- Guenther, D. B., Kallinger, T., Zwintz, K., et al. 2009, ApJ, 704, 1710 [NASA ADS] [CrossRef] [Google Scholar]
- Handler, G. 2009, in Stellar Pulsation: Challenges for Theory and Observation, eds. J. A. Guzik, & P. A. Bradley, AIP Conf. Ser., 1170, 403 [NASA ADS] [CrossRef] [Google Scholar]
- Holdsworth, D. L., Smalley, B., Gillon, M., et al. 2014, MNRAS, 439, 2078 [NASA ADS] [CrossRef] [Google Scholar]
- Kallinger, T., Zwintz, K., & Weiss, W. 2008, A&A, 488, 279 [NASA ADS] [CrossRef] [EDP Sciences] [Google Scholar]
- Kurtz, D. W., Shibahashi, H., Murphy, S. J., Bedding, T. R., & Bowman, D. M. 2015, MNRAS, 450, 3015 [NASA ADS] [CrossRef] [Google Scholar]
- Kurtz, D. W., Bowman, D. M., Ebo, S. J., et al. 2016, MNRAS, 455, 1237 [NASA ADS] [CrossRef] [Google Scholar]
- Mow, B., Reinhart, E., Nhim, S., & Watkins, R. 2016, AJ, 152, 17 [NASA ADS] [CrossRef] [Google Scholar]
- Murphy, S. J., Grigahcène, A., Niemczura, E., Kurtz, D. W., & Uytterhoeven, K. 2012, MNRAS, 427, 1418 [CrossRef] [Google Scholar]
- Netzel, H., & Smolec, R. 2022, MNRAS, 515, 4574 [NASA ADS] [CrossRef] [Google Scholar]
- Netzel, H., Pietrukowicz, P., Soszyński, I., & Wrona, M. 2022, MNRAS, 510, 1748 [Google Scholar]
- Niu, J.-S., & Xue, H.-F. 2022, ApJ, 938, L20 [NASA ADS] [CrossRef] [Google Scholar]
- Niu, J.-S., Fu, J.-N., & Zong, W.-K. 2013, Res. Astron. Astrophys., 13, 1181 [CrossRef] [Google Scholar]
- Niu, J.-S., Fu, J.-N., Li, Y., et al. 2017, MNRAS, 467, 3122 [NASA ADS] [Google Scholar]
- Niu, J.-S., Liu, Y., & Xue, H.-F. 2023, AJ, 166, 43 [NASA ADS] [CrossRef] [Google Scholar]
- Pápics, P. I., Tkachenko, A., Van Reeth, T., et al. 2017, A&A, 598, A74 [Google Scholar]
- Pietrukowicz, P., Dziembowski, W. A., Mróz, P., et al. 2013, Acta Astron., 63, 379 [Google Scholar]
- Poretti, E., Rainer, M., Weiss, W. W., et al. 2011, A&A, 528, A147 [NASA ADS] [CrossRef] [EDP Sciences] [Google Scholar]
- Rathour, R. S., Smolec, R., & Netzel, H. 2021, MNRAS, 505, 5412 [NASA ADS] [CrossRef] [Google Scholar]
- Smith, J. C., Stumpe, M. C., Van Cleve, J. E., et al. 2012, PASP, 124, 1000 [Google Scholar]
- Steindl, T., Zwintz, K., & Vorobyov, E. 2022, Nat. Commun., 13, 5355 [NASA ADS] [CrossRef] [Google Scholar]
- Stumpe, M. C., Smith, J. C., Van Cleve, J. E., et al. 2012, PASP, 124, 985 [Google Scholar]
- Ulusoy, C., Ulas, B., Gülmez, T., et al. 2013, MNRAS, 433, 394 [NASA ADS] [CrossRef] [Google Scholar]
- Uytterhoeven, K., Moya, A., Grigahcène, A., et al. 2011, A&A, 534, A125 [CrossRef] [EDP Sciences] [Google Scholar]
- Van Beeck, J., Bowman, D. M., Pedersen, M. G., et al. 2021, A&A, 655, A59 [NASA ADS] [CrossRef] [EDP Sciences] [Google Scholar]
- Wils, P., Rozakis, I., Kleidis, S., Hambsch, F. J., & Bernhard, K. 2008, A&A, 478, 865 [NASA ADS] [CrossRef] [EDP Sciences] [Google Scholar]
- Wu, Y. 2001, MNRAS, 323, 248 [NASA ADS] [CrossRef] [Google Scholar]
- Xue, H.-F., & Niu, J.-S. 2020, ApJ, 904, 5 [NASA ADS] [CrossRef] [Google Scholar]
- Xue, W., Niu, J.-S., Xue, H.-F., & Yin, S. 2023, Res. Astron. Astrophys., 23, 075002 [CrossRef] [Google Scholar]
- Zong, W., Charpinet, S., & Vauclair, G. 2016a, A&A, 594, A46 [NASA ADS] [CrossRef] [EDP Sciences] [Google Scholar]
- Zong, W., Charpinet, S., Vauclair, G., Giammichele, N., & Van Grootel, V. 2016b, A&A, 585, A22 [NASA ADS] [CrossRef] [EDP Sciences] [Google Scholar]
- Zong, W., Charpinet, S., Fu, J.-N., et al. 2018, ApJ, 853, 98 [NASA ADS] [CrossRef] [Google Scholar]
Appendix A: Harmonics of f0 and f1
The amplitude and frequency variations in the fundamental and first overtone pulsation modes along with their first and second harmonics (f0, 2f0, 3f0, f1, 2f1, and 3f1) are presented in Figures A.1 and A.2.
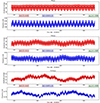 |
Fig. A.1. Amplitude and frequency variations in the independent pulsation mode (f0) and its first and second harmonics (2f0 and 3f0). |
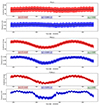 |
Fig. A.2. Amplitude and frequency variations in the independent pulsation mode (f1) and its first and second harmonics (2f1 and 3f1). |
Appendix B: Photometric data reduction
This study utilized SC photometric data of KIC 6382916 obtained from the Kepler space telescope (Stumpe et al. 2012; Smith et al. 2012). The data span from BJD 2455064 to 2455091 (Quarter 02, with a small portion of discontinuous data removed, approximately 2 days in length) and were downloaded from the Mikulski Archive for Space Telescope (MAST)4. The data, in the form of reduced BJD and magnitudes, were then normalized to have a zero mean. Figure B.1 provides an overview of the normalized SC data in both the time and frequency domains.
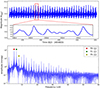 |
Fig. B.1. Overview of the normalized SC data in the time and frequency domain of KIC 6382916. We zoom in on the region surrounded by the red rectangular boxes to see the observed light curves in detail. The three independent frequencies are marked as colored dots. |
All the aforementioned normalized SC data were pre-whitened to extract the frequencies and amplitudes of the pulsation modes. The process was terminated once all the frequencies studied in Niu & Xue (2022, a total of 23 frequencies) had been identified (see Table 1). For ease of comparison, the IDs of the pulsation modes in this work were arranged in the same order as in Niu & Xue (2022), rather than in descending order of amplitudes based on the SC data.
The short-time Fourier transformation (Bowman et al. 2016; Zong et al. 2018; Niu & Xue 2022; Niu et al. 2023) was then applied to the normalized SC data to determine the variations in the amplitudes and frequencies. In this process, a time window of 6 days was moved from the start to the end time of the SC data, with a step of 0.02 days. At each step, the pre-whitening process was conducted to extract the amplitudes and frequencies of the specific 23 pulsation modes. The phase was considered a free parameter and was not the focus of this study.
Next, we collected the amplitudes and frequencies from each moving window for each of the 19 pulsation modes. The times were defined as the midpoints of the windows. The remaining four pulsation modes (F14, F15, F16, and F22) exhibited complex interactions with the nearby pulsation modes, making it difficult to identify and distinguish them from each other (see, e.g., Figure E.5). The variations in the amplitudes and frequencies of the 19 pulsation modes are shown in Figures E.1, E.2, E.3, and E.4.
In this study, the pre-whitening process was carried out using Fourier decomposition, which can be represented by the formula
![Mathematical equation: $$ \begin{aligned} m = m_{0} + \sum A_{i} \sin \left[ 2 \pi (f_{i} t + \phi _{i}) \right] ~, \end{aligned} $$](/articles/aa/full_html/2024/02/aa48757-23/aa48757-23-eq6.gif) (B.1)
(B.1)
where m0 is the shifted value, Ai is the amplitude, fi is the frequency, and ϕi is the corresponding phase. The uncertainties of the amplitudes (σA), frequencies (σf), and phases (σϕ) throughout this study were estimated using the framework introduced in Niu & Xue (2022) and Niu et al. (2023).
Appendix C: Overall indicators of pulsation modes
Table 1 presents the absolute and relative variations of these 19 pulsation modes. The absolute variation is defined as the difference between the maximum and minimum values of the mode (Δf ≡ fmax − fmin and ΔA ≡ Amax − Amin), while the relative variation is the ratio of the difference to the mean values ( and
and  ). The relative variations in the amplitudes and the absolute variations in the frequencies are presented in Figures E.1, E.2, E.3, and E.4.
The ρA, f in Table 1 and Figures E.1, E.2, E.3, and E.4 represents the Pearson correlation coefficient between the amplitude and frequency for each of the 19 pulsation modes.
Appendix D: Time-frequency diagram
The time-frequency diagram (Figure E.5 and panel (c) of Figure 1) was plotted with a time window of 6 days, which was moved from the start to the end time of the SC data, with a step of 0.01 days. The power (square of amplitude) is indicated by the color bar.
It should be noted that the pulsation modes marked in the time-frequency diagram are for illustration purposes only and may not be accurate. This is because it is difficult to identify a pulsation mode with drastic variations in amplitude and frequency, let alone a strong interaction with nearby modes.
Appendix E: Additional figures
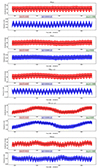 |
Fig. E.1. Amplitude and frequency variations in the 19 pulsation modes. |
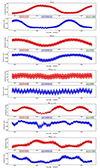 |
Fig. E.2. Amplitude and frequency variations in the 19 pulsation modes, Part II. |
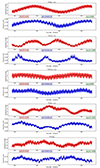 |
Fig. E.3. Amplitude and frequency variations in the 19 pulsation modes, Part III. |
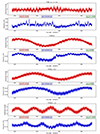 |
Fig. E.4. Amplitude and frequency variations in the 19 pulsation modes, Part IV. |
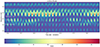 |
Fig. E.5. Time-frequency diagram showing interaction details in 2.75 − 3.75 c/d. |
All Tables
All Figures
|
Fig. 1. Variation in the amplitudes and frequencies of F5 and its partner, F8. Panel a: Amplitude and frequency variations of F5. Panel b: Amplitude and frequency variations of F8. Panel c: Time-frequency diagram, which presents interaction details in 7.5 − 8.5 c/d. |
| In the text | |
|
Fig. 2. Interaction diagrams of the amplitudes and frequencies of the 19 pulsation modes. |
| In the text | |
|
Fig. A.1. Amplitude and frequency variations in the independent pulsation mode (f0) and its first and second harmonics (2f0 and 3f0). |
| In the text | |
|
Fig. A.2. Amplitude and frequency variations in the independent pulsation mode (f1) and its first and second harmonics (2f1 and 3f1). |
| In the text | |
|
Fig. B.1. Overview of the normalized SC data in the time and frequency domain of KIC 6382916. We zoom in on the region surrounded by the red rectangular boxes to see the observed light curves in detail. The three independent frequencies are marked as colored dots. |
| In the text | |
|
Fig. E.1. Amplitude and frequency variations in the 19 pulsation modes. |
| In the text | |
|
Fig. E.2. Amplitude and frequency variations in the 19 pulsation modes, Part II. |
| In the text | |
|
Fig. E.3. Amplitude and frequency variations in the 19 pulsation modes, Part III. |
| In the text | |
|
Fig. E.4. Amplitude and frequency variations in the 19 pulsation modes, Part IV. |
| In the text | |
|
Fig. E.5. Time-frequency diagram showing interaction details in 2.75 − 3.75 c/d. |
| In the text | |
Current usage metrics show cumulative count of Article Views (full-text article views including HTML views, PDF and ePub downloads, according to the available data) and Abstracts Views on Vision4Press platform.
Data correspond to usage on the plateform after 2015. The current usage metrics is available 48-96 hours after online publication and is updated daily on week days.
Initial download of the metrics may take a while.