Open Access
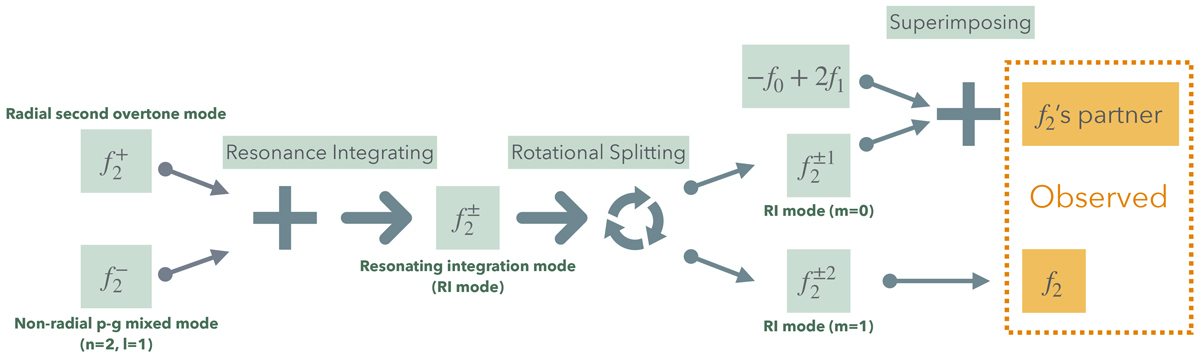
Fig. 1.
Download original image
Framework based on the RI mode. The two elements in the orange dotted box represent frequencies directly observed in the frequency domain of light curves. The annotation of the labels are presented in bolded dark font.
Current usage metrics show cumulative count of Article Views (full-text article views including HTML views, PDF and ePub downloads, according to the available data) and Abstracts Views on Vision4Press platform.
Data correspond to usage on the plateform after 2015. The current usage metrics is available 48-96 hours after online publication and is updated daily on week days.
Initial download of the metrics may take a while.