Fig. 2.
Download original image
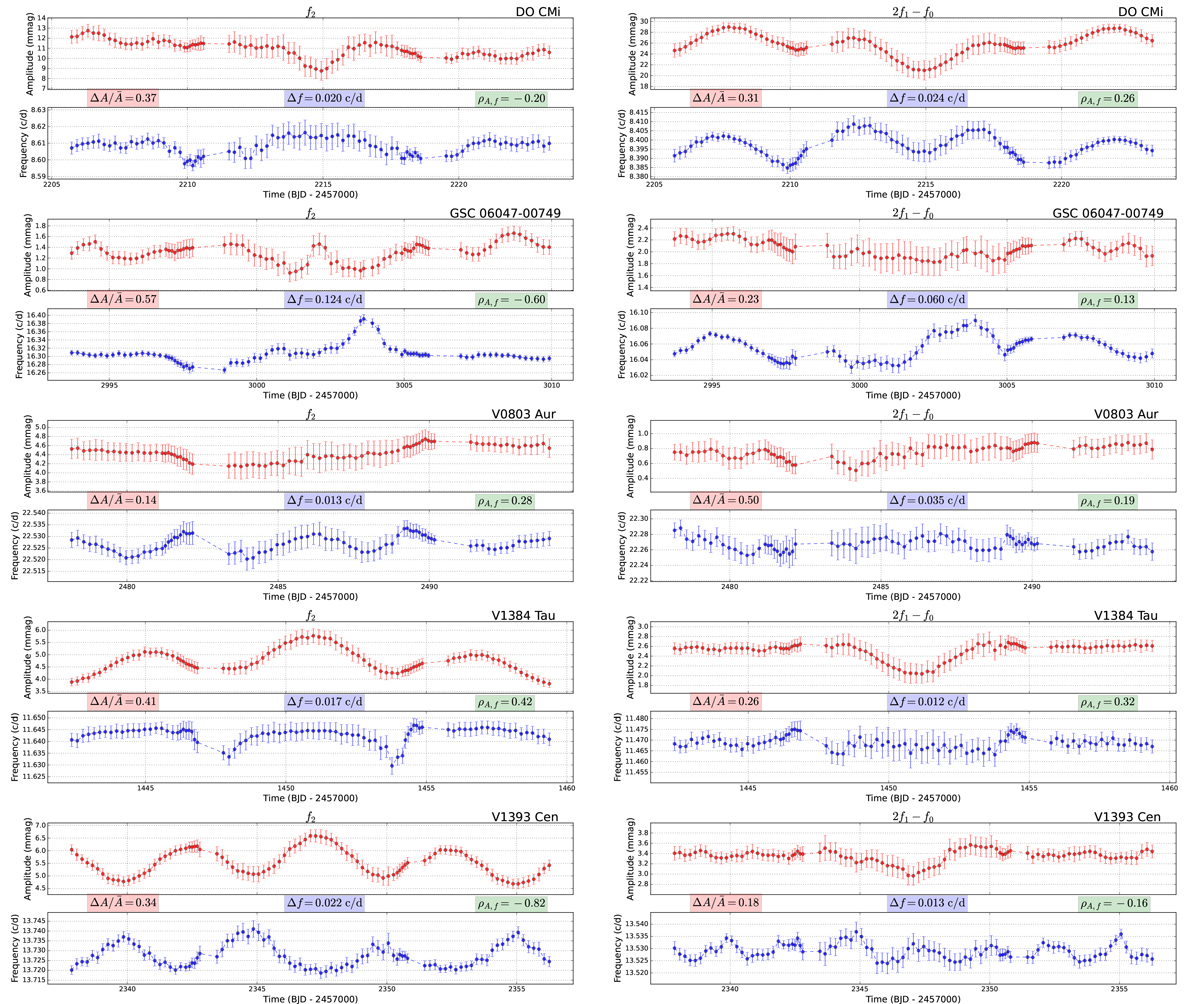
Amplitude and frequency variations in f2 and its partner pulsation mode (−f0 + 2f1) for the five HADS. ![]() is highlighted in red, which represents the relative amplitude variations. Δf is highlighted in blue, which represents the absolute frequency variations. ρA, f is highlighted in green, which represents a perfect correlation or anti-correlation between the variations in the amplitude and frequency when it equals +1 or –1, respectively.
is highlighted in red, which represents the relative amplitude variations. Δf is highlighted in blue, which represents the absolute frequency variations. ρA, f is highlighted in green, which represents a perfect correlation or anti-correlation between the variations in the amplitude and frequency when it equals +1 or –1, respectively.
Current usage metrics show cumulative count of Article Views (full-text article views including HTML views, PDF and ePub downloads, according to the available data) and Abstracts Views on Vision4Press platform.
Data correspond to usage on the plateform after 2015. The current usage metrics is available 48-96 hours after online publication and is updated daily on week days.
Initial download of the metrics may take a while.