| Issue |
A&A
Volume 697, May 2025
|
|
|---|---|---|
| Article Number | A30 | |
| Number of page(s) | 19 | |
| Section | Cosmology (including clusters of galaxies) | |
| DOI | https://doi.org/10.1051/0004-6361/202553733 | |
| Published online | 01 May 2025 | |
Period–luminosity relations for Galactic Type II Cepheids in the Sloan bands
1
Nicolaus Copernicus Astronomical Center, Polish Academy of Sciences, Bartycka 18, 00-716 Warszawa, Poland
2
Universidad de Concepción, Departamento de Astronomía, Casilla 160-C, Concepción, Chile
3
Nicolaus Copernicus Astronomical Center, Polish Academy of Sciences, Rabiańska 8, 87-100 Toruń, Poland
⋆ Corresponding author: This email address is being protected from spambots. You need JavaScript enabled to view it.
Received:
13
January
2025
Accepted:
10
March
2025
Abstract
Context. Type II Cepheids (T2Ceps), alongside RR Lyrae stars, serve as important distance indicators for old Population II stars due to their period–luminosity (PL) relations. However, few studies of these relations in the Sloan photometric system have been conducted.
Aims. Our goal is to calibrate PL relations (and their counterparts in Wesenheit magnitudes) in the Sloan–Pan-STARRS gP1rP1iP1 bands for Galactic T2Ceps located in the vicinity of the Sun.
Methods. We collected data for 16 T2Ceps of the BL Her-type and 17 of the W Vir-type using 40 cm telescopes of the Las Cumbres Observatory Global Telescope Network. Geometric parallaxes were adopted from Gaia Data Release 3.
Results. We have calibrated PL and period–Wesenheit relations for Milky Way BL Her and W Vir stars in the solar neighborhood, as well as for a combined sample of the two types.
Conclusions. The relationships derived here will allow the determination of the distances to the T2Ceps that will be discovered by the Legacy Survey of Space and Time survey and, in turn, to probe the extended halo of the Milky Way, as well as the halos of nearby galaxies. To the best of our knowledge, the relations derived in this study are the first for Milky Way T2Ceps in the Sloan bands.
Key words: stars: distances / stars: variables: Cepheids / solar neighborhood
© The Authors 2025
 Open Access article, published by EDP Sciences, under the terms of the Creative Commons Attribution License (https://creativecommons.org/licenses/by/4.0), which permits unrestricted use, distribution, and reproduction in any medium, provided the original work is properly cited.
This article is published in open access under the Subscribe to Open model. This email address is being protected from spambots. You need JavaScript enabled to view it. to support open access publication.
1. Introduction
Cepheid variables are pulsating stars that are useful as distance indicators thanks to their period–luminosity (PL) relations, also known as the Leavitt law, first discovered by Henrietta Swan Leavitt (Leavitt & Pickering 1912). Further studies of these variables led to a discovery of hydrogen emission lines in spectra of the Cepheid W Virginis, which distinguished it from other Cepheids (Joy 1937). Joy (1940) reported changes in the spectrum of the Cepheid V154 in the globular cluster M3 that resembled those in W Virginis. Walter Baade (Baade 1944) resolved stars in the center of the M31 for the first time. These observations led him to distinguish between two stellar populations, known today as Population I and II. Later, he discovered the existence of two types of Cepheid variables, each having a different PL relation (Baade 1956). Population II Cepheids were found to be approximately 1.5 mag fainter in the blue or visual compared to Population I Cepheids with the same periods. The separation of these groups of pulsators resulted in a doubling of the estimated distances to nearby galaxies, thereby revising the cosmic distance scale. Today, the terms Type I (or classical) Cepheids and Type II Cepheids (T2Ceps) are used to describe these two types of variables. They occupy different regions of the classical instability strip, reflecting their different evolutionary and physical properties. Type II Cepheids are old, evolved stars less massive than the Sun, and because of that they serve as distance indicators to old stellar populations, alongside other classical pulsators, in particular RR Lyrae stars. In contrast, Type I Cepheids, which are young radially pulsating massive evolved giants, serve as distance indicators to young stellar populations. Their locations within the Milky Way (MW) are also different. Type I Cepheids are mostly found in the Galactic disk and are strongly associated with the spiral arms (Skowron et al. 2019). Meanwhile, T2Ceps are commonly found in old stellar populations like the Galactic bulge (Dékány et al. 2019) and halo (Matsunaga et al. 2006).
T2Ceps are divided into subgroups depending on the distribution of their pulsation period, although this division is not strict and depends on the environment (e.g., Gingold 1985; Soszyński et al. 2011). The first division of T2Ceps might date back to 1949 (Joy 1949). Joy distinguished two groups: short-period (with periods between 1 and 3 days) and long-period T2Ceps (13 − 19 days); the second resembled W Virginis. The justification for such a division was the existence of a gap in the periods between 5 and 10 days, very poorly populated by stars. This division continues to be used today; the first group is now known as BL Her-type stars and the second group as W Wir-type stars (e.g., Soszyński et al. 2008, 2011). The second class smoothly transitions into a third group of stars with even longer periods (above about 20 days) known as RV Tau-type stars, whose characteristics include different depths of consecutive light minima (period doubling). It is believed that these three subclasses are similar stars in different stages of stellar evolution. Soszyński et al. (2008) distinguished another class of T2Ceps that are on average brighter and bluer than regular W Vir stars, and also have different light curve shapes, and called them peculiar W Vir (hereafter pW Vir) stars. The explanation for their peculiarity is binarity, as indicated by the ellipsoidal or eclipsing variability often found in their light curves.
PL relations of T2Ceps have been extensively investigated in many bands, both theoretically (e.g., Di Criscienzo et al. 2007; Das et al. 2021, 2024) and empirically. Of particular interest to the community are the PL relations in the near-infrared (NIR) bands because of the low dependence on the reddening. The NIR PL relations are derived in different environments containing old stellar populations in the MW, such as the Galactic bulge (e.g., Groenewegen et al. 2008; Bhardwaj et al. 2017b; Braga et al. 2018), Galactic field (e.g., Wielgórski et al. 2022), and Galactic globular clusters (e.g., Matsunaga et al. 2006; Bhardwaj et al. 2022), as well as nearby galaxies (e.g., Matsunaga et al. 2009, 2011; Ripepi et al. 2015; Bhardwaj et al. 2017a, 2022; Sicignano et al. 2024). There also exist a number of works in the optical range (see, e.g., Alcock et al. 1998; Groenewegen & Jurkovic 2017; Iwanek et al. 2018; Ripepi et al. 2023). However, only two studies have employed wide-band Sloan photometric filters (ugriz; Fukugita et al. 1996), namely Ngeow et al. (2022) for Galactic globular clusters and Kodric et al. (2018) for M31; both used the Panoramic Survey Telescope and Rapid Response (Pan-STARRS) version of the Sloan photometric system (Tonry et al. 2012). In particular, there are no PL relation determinations based on T2Cep variables from the vicinity of the Sun in those bands, which we endeavor to change in this study.
We aim to establish the PL relations and their counterparts in Wesenheit magnitudes (Madore 1982) for Galactic T2Ceps in the solar neighborhood using the Sloan gri bands calibrated specifically to the Pan-STARRS implementation of this photometric system, which will be used, among others, in the upcoming 10-year Vera C. Rubin Observatory Legacy Survey of Space and Time (Rubin-LSST; Ivezić et al. 2019). Therefore, providing accurate calibrations of the PL relations within this photometric system is of great interest. This study complements our earlier investigations into similar relations for other types of pulsating stars, namely classical Cepheids (Narloch et al. 2023) and RR Lyrae stars (Narloch et al. 2024). To the best of our knowledge, existing PL relations in the Sloan bands for T2Ceps in the MW have so far been derived only for stars in globular clusters (Ngeow et al. 2022); our relations are thus the first of their kind. We believe that this work will serve as a valuable contribution to the field and a practical tool for measuring distances in the Universe in the era of large-scale sky surveys like Rubin-LSST.
This paper is organized as follows. Section 2 provides information about the sample of Galactic T2Ceps observed for the project, the collected scientific data, their reduction, and the methods used to determine the absolute magnitudes of our stars. In Sect. 3 we describe the derivation of the PL and period–Wesenheit (PW) relations and explain the reasons for rejecting specific stars from the fitting procedure. Section 4 provides a short discussion of the results, while Sect. 5 concludes the paper.
2. Data
2.1. Sample of stars and classification
The original sample of T2Ceps was selected from lists of variable stars used for other projects of the Araucaria group (Gieren et al. 2005). We observed a total of 17 BL Her and 22 W Vir-type stars. However, in a later Fourier analysis of the light curves (presented in Appendix A), V572 Aql turned out to be a Type I Cepheid pulsating in the first overtone mode. Additionally, three stars (AL Vir, AP Her, and BH Oph) were classified as pW Vir stars based on the shape of their light curves, while TW Cap and V1711 Sgr were identified as RV Tau-type stars. Eventually, we were left with 16 BL Her-type stars and 17 W Vir-type stars for calibrating the PL relations.
The range of GaiaG-band magnitudes for BL Her-type stars is between 7.11 and 13.71 mag (with a mean of about 11.20 mag), and for W Vir-type stars between 9.04 and 13.50 mag (with a mean of about 11.64 mag). The distances derived as the inverse of Gaia Data Release 3 (DR3) parallaxes (Gaia Collaboration 2023), corrected for zero point (ZP) offsets as proposed by Lindegren et al. (2021), for BL Her stars range from about 0.3 to 5.6 kpc (with a median of about 2.0 kpc), and for W Vir, the range is from about 1.1 to 13.4 kpc (with a median of about 3.6 kpc). Figure 1 shows the sky distribution of the analyzed stars.
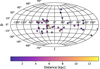 |
Fig. 1. Location of the T2Ceps – BL Her-types (circle) and W Vir-types (squares) – used to establish the PL relations in this paper given in Galactic coordinates, as well as other types of variables originally observed for the project and reclassified later – pW Vir types (diamonds), RV Tau types (triangles), and a Type I first-overtone Cepheid (star). |
Pulsation periods were adopted from the International Variable Star Index1 (AAVSO), and they range between 1.09 and 3.95 days for BL Her, and 6.17–19.95 days for W Vir-type stars. Table B.1 lists the parameters of all the stars in the original sample. For HQ Cen and RS Pav, with alternating deep and shallow minima, we adopted half of the period given by AAVSO. We mark the periods of these stars in Table B.1 with a double asterisk.
2.2. Data and reduction
Data for the project were collected from August 2021 to July 2022 using 14 robotic 40 cm telescopes from the Las Cumbres Observatory (LCO) Global Telescope Network2. Observations were conducted under the programs CLN2021B-008 and CLN2022A-008. Images were taken with Sloan g′r′i′ filters using 3K × 2K SBIG STL-6303 cameras, which provided a field of view of 29.2 × 19.5 arcmin2 and a pixel size of 0.571 arcsec per pixel, with no binning. The air mass of the observations ranged from 1.0 to 1.6, and the average seeing was approximately 2.40, 2.32, and 2.36 arcsec in the Sloan g′, r′ and i′ bands, respectively.
We retrieved pre-reduced and processed images from the LCO Archive3, which had been processed with the LCO BANZAI4 pipeline. Aperture photometry and data calibration followed the procedures outlined in Narloch et al. (2023), which we recommend for detailed methodology. The instrumental magnitudes obtained with the standard DAOPHOT package (Stetson 1987) were cross-matched with the ATLAS All-Sky Stellar Reference Catalog version 2 (ATLAS-REFCAT2; Tonry et al. 2018), which is on the Pan-STARRS version of the Sloan photometric system (Tonry et al. 2012), referred to as gP1rP1iP1 later in the text. The mean DAOPHOT photometric uncertainties were about 0.04 mag and 0.03 mag for gP1 and rP1iP1 filters, respectively, for stars with magnitudes in the range of 9.0 < gP1 < 15.0 mag. This range encompasses the magnitudes of our sample stars and most of the reference stars. For the photometric calibration, we used the equations presented in Narloch et al. (2023), which were selected in such a way as to minimize the influence of the nonlinearity of the LCO SBIG cameras. We note that this effect was less severe for T2Ceps when compared to classical Cepheids, as most of the reference stars had brightness levels similar to that of the target star.
The intensity-averaged mean apparent magnitudes were obtained by fitting Fourier series to the light curves presented in Appendix C (Figs. C.1–C.3), and are given in Cols. 8–10 of Table B.1. The orders of the Fourier series ranged from 2 to 9 and were chosen to best fit the shape of the light curves. For those of W Vir- and RV Tau-type stars, which exhibit varying depths of minima (marked in Table B.1 with single and double asterisks), the mean magnitudes were calculated by fitting a Fourier series with double their formal periods, while on the PL relations they were marked with single periods, which are intervals between successive minima.
2.3. Reddening
We corrected the mean magnitudes of our stars using the E(B − V) color excess values from the reddening map of Schlafly & Finkbeiner (2011, hereafter SF map), integrated up to the distance of the target stars with the assumption of the 3D MW model from Drimmel & Spergel (2001, see Suchomska et al. 2015 for details of adopted parameters). The values used are given in Col. 7 of Table B.1. The extinction vectors (Rλ) for the Pan-STARRS gP1rP1iP1 bands were adopted from Green et al. (2019, see their Table 1), with values of Rg = 3.518, Rr = 2.617 and Ri = 1.971. These values were used to calculate three Wesenheit indices, which are inherently reddening-free for a specific reddening law (Madore 1982). We defined the Wesenheit indices as follows: Wrri = r − 4.051(r − i)−μ, Wrgr = r − 2.905(g − r)−μ, and Wggi = g − 2.274(g − i)−μ, where μ represents the distance modulus (DM).
2.4. Distances
To calculate the absolute magnitudes (Mλ) of stars, necessary for calibrating the PL relations, from the de-reddened mean apparent magnitudes (mλ), one needs to know the distances of the target stars. Analogously to Narloch et al. (2024), we applied four different approaches to accomplish this: the parallax method, the astrometry-based luminosity (ABL) method (Feast & Catchpole 1997; Arenou & Luri 1999), and finally geometric and photogeometric distances provided by Bailer-Jones et al. (2021). The applied equations used to calculate the absolute magnitudes in each method can be found in Narloch et al. (2024).
The range of Gaia DR3 parallaxes of our sample stars, corrected for the ZP offset calculated as proposed by Lindegren et al. (2021)5 by taking into account the ecliptic latitude, magnitude, and color of a star, was between 0.18 and 3.97 mas for BL Her stars (with a median of 0.50 mas), and about 0.07 to 0.94 mas for W Vir stars (with a median of about 0.28 mas). They are provided in Col. 4 of Table B.1. The range of applied ZP offset corrections was from −15 to −44 μas for BL Her stars (with a mean of about −30 μas), and from −4 to 44 μas for W Vir stars (with a mean of about −25 μas). Lindegren et al. (2021) recommended including an uncertainty of a few μas in the ZP; therefore, we adopted 5 μas as the systematic error.
The quality of the parallaxes was evaluated using two parameters: the renormalised unit weight error (RUWE) and goodness-of-fit (GOF) given in the Gaia DR3 catalog. The RUWE parameter is sensitive to the photo-centric motion of unresolved objects, such as astrometric binaries. Meanwhile, GOF can be used as an indicator of the level of asymmetry of a source (e.g., Riess et al. 2021). Based on the criteria from Breuval et al. (2021) and Wielgórski et al. (2022), we excluded stars with RUWE > 1.4 or GOF > 12.5 from our T2Ceps sample. One BL Her-type star (V465 Oph) was rejected based on the RUWE criterion, along with three W Vir-type stars (AL Lyr, ST Pup, and TX Del). Additionally, one RV Tau-type star (V1711 Sgr) did not meet this parallax quality standard. Among those stars, only W Vir-type stars had GOF > 12.5, making RUWE the stricter criterion in our case.
The mean parallax uncertainty for T2Ceps from our sample (given in Col. 4 of Table B.1) is approximately 19 μas. During the calculations, we found that one of the W Vir-type stars falls within the problematic magnitude range of G = 11.0 ± 0.2 mag, where the transition between Gaia window classes may impact the parallax ZP (see Fig. 1 in Lindegren et al. 2021). Another two BL Her-type stars fall within the range of G = 12.0 ± 0.2 mag. We quadratically added 10 μas to the parallax uncertainties of those stars, thereby following Breuval et al. (2021), to account for potential additional errors caused by the transition windows. Furthermore, following the recommendation of Riess et al. (2021), we eventually increased all Gaia DR3 parallax uncertainties by 10% to account for potential additional uncertainties.
3. Derived relations
3.1. PL and PW relations in the Sloan bands
We used absolute Sloan-Pan-STARRS gP1rP1iP1 magnitudes, derived as described in previous sections, for the calibration of the PL relation, defined as
 (1)
(1)
as well as analogous relations for Wesenheit magnitudes (derived in Sect. 2.3), defined as follows:
 (2)
(2)
where aλ and bλ (and a and b, analogously) are the sought-after slope and intercept, respectively. In order to minimize correlation between the two parameters, we subtracted the logarithm of a pivot period (log P0). Following Wielgórski et al. (2022), we adopted log P0 = 0.3 for BL Her-type stars, while for W Vir stars we chose log P0 = 1.2. Soszyński et al. (2008) indicate that the PL relations for T2Ceps are not linear across the entire range of periods, so they rather should be fitted separately for BL Her, W Vir, and RV Tau stars. However, the nonlinear behavior is particularly characteristic for RV Tau-type stars, while the other two classes of T2Ceps exhibit linear behavior. On the other hand, Sicignano et al. (2024) emphasize that the three subclasses of T2Ceps do not follow unique PL relation particularly in optical bands, while they start to do that in the bands redder than I-band. This could be related with the location of specific T2Cep types in the instability strip in the optical bands. Nevertheless, we also derived coefficients for a combined sample of BL Her+W Vir stars (as often is done in the literature; e.g., Ngeow et al. 2022), for which we adopted log P0 = 0.7, similarly to Wielgórski et al. (2022). To test if BL Her and W Vir stars can be treated as one sample, we performed the F-Snedecor statistical test, which checks the equality of two variances. We compared the variances for a combined sample where the two populations of stars were fitted with separate and global PL and PW relations. We found our F-values to be smaller than the critical values for degrees of freedom of 23 (PL relations) and 25 (PW relations) at a significance level of α = 0.05. The interpretation of this result is that the obtained values of standard deviations do not differ from each other in a statistically significant manner (i.e., the compared methods do not differ in terms of precision). Therefore, there is no basis for rejecting the hypothesis that BL Her and W Vir stars can be fitted together. However, taking into consideration the lack of consensus on this matter existing in the literature, we decided to calibrate separate PL and PW relations for BL Her and W Vir stars, as well as a single relation for the combined sample.
For the absolute magnitudes calculated with the ABL method, we fitted the following relation:
![Mathematical equation: $$ \begin{aligned} ABL_{\lambda } = 10^{0.2[a_{\lambda }(\log P - \log P_0) + b_{\lambda }]}, \end{aligned} $$](/articles/aa/full_html/2025/05/aa53733-25/aa53733-25-eq3.gif) (3)
(3)
and analogously for Wesenheit magnitudes in the form
![Mathematical equation: $$ \begin{aligned} ABL_{W} = 10^{0.2[a(\log P - \log P_0) + b]}. \end{aligned} $$](/articles/aa/full_html/2025/05/aa53733-25/aa53733-25-eq4.gif) (4)
(4)
Similarly to Narloch et al. (2023), we used the curve_fit function from the scipy Python library to perform the fitting, followed by a 3σ-clipping procedure. For the final statistical uncertainties of the resulting coefficients, we adopted the errors returned by the fitting function. The derived coefficients for all four methods are presented in Table 1. Figures 2 and 3 present resulting PL and PW relations, respectively, based on the parallax and ABL methods only. The error bars for each star are derived from the error propagation taking into account statistical mean magnitudes and parallaxes errors.
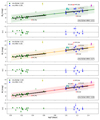 |
Fig. 2. PL relations for T2Ceps based on the reddening values from Schlafly & Finkbeiner (2011) and reddening vectors (Rλ) from Green et al. (2019). We show the BL Her- and W Vir-type stars adopted for the derivation of PL relations (filled circles and squares); stars with RUWE > 1.4 (open marks); stars manually rejected from the fit (red crosses; see Sect. 3 for an explanation); a first-overtone Type I Cepheid (yellow star); pW Vir-type stars (cyan diamonds), RV Tau-type stars (magenta triangles), the fit to Eq. (1) for BL Her and W Vir stars separately as well as combined (solid line), analogous fit to Eq. (3) (dashed line), and the ±3rms for BL Her and W Vir stars and the combined sample (shaded areas). The pivot logarithms of log P0 = 0.3, 1.2, 0.7 were used to fit the BL Her, W Vir, and combined sample, respectively. |
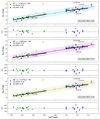 |
Fig. 3. PW relations for T2Ceps. Wesenheit indices were calculated using the reddening vectors (Rλ) from Green et al. (2019). We show BL Her and W Vir-type stars adopted for derivation of PW relations (filled circles and squares); stars with RUWE > 1.4 (open marks); stars manually rejected from the fit (red crosses; see Sect. 3 for an explanation); a first-overtone Type I Cepheid (yellow star); pW Vir-type stars (cyan diamonds), RV Tau-type stars (magenta triangles), the fit to Eq. (2) for BL Her and W Vir stars separately, as well as combined (solid lines), analogous fit to Eq. (4) (dashed line); and the ±3rms for BL Her and W Vir stars and combined sample (shaded areas). The pivot logarithms of log P0 = 0.3, 1.2, 0.7 were used to fit the BL Her, W Vir, and combined sample, respectively. |
In the final fitting of the PL relations we used 14 BL Her-type and 10 W Vir-type stars (i.e., 24 stars in the combined sample). In the case of the PW relations, these were 15 and 11 stars, respectively, which gave 26 stars in the combined sample. Some stars have been manually excluded from the fit. These will be discussed in the next Sect. 3.2. The rms of the PL relations were between 0.20 − 0.24, 0.32 − 0.39, and 0.26 − 0.31 for BL Her, W Vir and combined sample, respectively. For PW relations these numbers are 0.19 − 0.23, 0.28 − 0.33, and 0.24 − 0.27, respectively.
3.2. Stars excluded from the fit
One star among BL Her-type variables, AU Peg, deviates toward fainter brightnesses on the PL relation. This star was excluded by Wielgórski et al. (2022) from their NIR PL relations, where they also noted its unusually red color (J − Ks ≈ 0.7 mag). Our data confirm this observation (see Fig. 4), showing that this star stands out in color compared to other variables of this type. Consistent with Wielgórski et al. (2022), we also observe that the deviation from the fitted PL relation is more pronounced in bluer bands and disappears in Wesenheit indices, suggesting problems with reddening for this star. Although the reddening value listed in Table B.1 is relatively low, there are grounds to believe it may be underestimated. AU Peg has been identified as a single-lined spectroscopic binary with a likely more massive companion (Harris et al. 1979), a short orbital period of Porb ≈ 53 days (Harris et al. 1984), and shows rapid period changes that may be due to the companion star (e.g., Vinko et al. 1993). McAlary & Welch (1986) postulated the presence of relatively thick circumstellar matter around the system. This circumstellar cloud might be responsible for the unusual color of AU Peg. As an additional test, we adopted reddening values from other sources to check if they improve the position of AU Peg in the PL relation. We used the STructuring by Inversion the Local Interstellar Medium (STILISM) map6 (Lallement et al. 2014; Capitanio et al. 2017), the Bayestar2019 3D reddening map (Green et al. 2019), accessed through the dustmap code7, and the reddening map from Schlegel et al. (1998, hereafter the SFD map). However, for AU Peg, the reddening values are very similar (SF: 0.046 mag, SFD: 0.054 mag, STILISM: 0.069 mag, Bayestar2019: 0.085 mag), and the new values do not change its position in the PL relations much, so the problem persists. We therefore decided to exclude this star from PL relation fit but retained it in the PW relation fit.
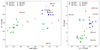 |
Fig. 4. Color index (g − i) of T2Ceps from the MW as a function of the logarithm of the pulsational period (left panel) and the color–magnitude diagram from those stars (right panel). |
Some W Vir-type stars deviated from the obtained relations, even after the 3σ-clipping procedure, so we decided to reject them manually from the fit. The first such example is DD Vel, which showed significant deviation in the PL relation, but not in the PW relation. Additionally, it deviates more in the blue and less in the red filters, which is an indication of an incorrect value of the adopted reddening, rather than the misclassification of this star as a T2Cep, which is quite certain (see Lemasle et al. 2015). Figure 4, where DD Vel is shifted significantly toward the bluer colors, also strongly suggests that the star is over-de-rredened. Indeed, the E(B-V) value for this star in Table B.1 is suspiciously large and most likely incorrect. It also lies above the NIR PL relationships of Wielgórski et al. (2022, see their Fig. 18), where they used the Schlafly & Finkbeiner (2011) maps as the source of the reddening values as well. Again, we tested the reddening values from other reddening maps, as we did for AU Peg in the previous paragraph. The reddening values from the SF and SFD maps are similarly large (SF: 1.334 mag, SFD: 1.551 mag), while the STILISM map gives a value of 0.201 mag, which, for a change, places DD Vel below the PL relation, strongly suggesting that this is also an incorrect value. On the other hand, the Bayestar2019 map does not provide a reddening value for this target at all. Therefore, we rejected DD Vel from the fit of the PL relations but kept it in the PW relations.
Wielgórski et al. (2022) noticed that the star QX Aqr lies below their NIR PL relations. The same is true in our optical data. The reason for this behavior is unknown, so we decided to manually reject this star from the fit of the PL and PW relations. In their work, they also report that the prototype of the class, W Vir itself lies below the NIR PL relation as well, but it does not appear to deviate from the relations in the Sloan bands. Hence, we kept this star in the fitting process.
The star V410 Sgr deviated from the PL and PW relations toward brighter magnitudes. Upon investigating its images, we noticed that it has a close neighboring star that falls within the aperture used for the photometry. To address this, we corrected the photometry for this star by using a smaller aperture (8.7 pixels, corresponding to about 5 arcsec, instead of 14 pixels as described in Narloch et al. 2023). The new magnitude of V410 Sgr, however, was only about 0.2 mag fainter, which still does not bring the star close to the PL or PW relations. In addition, V410 Sgr turns out to be the most distant star in our sample (see Table B.1), and although the parallax error is rather small, this value itself might be incorrect. An overestimated distance of the object translates into an absolute magnitude that is too bright, which is also suggested by the color–magnitude diagram from Fig. 4 (right panel). The Gaia DR4 release may potentially resolve this issue in the future. For the time being, we decided to manually exclude this star from the fitting process.
Similarly, CO Sct deviated significantly from the relationships, particularly the PW relations. It also seems to be too bright on the color-magnitude diagram (Fig. 4, right panel). It is the second most distant star in our sample (see Table B.1), having simultaneously the largest parallax error among our stars. Therefore, we decided to manually remove it from the fit as well.
Three stars classified as pW Vir indeed are clustered above determined relations, which is characteristic of these stars and seems to confirm their classification also based on PL and PW relations in addition to Fourier parameters. One RV Tau-type star and the first-overtone Type I Cepheid are also in locations on the PL plots typical of their variability types.
4. Discussion
4.1. The influence of the parallax ZP on the PL and PW relations
The Gaia parallaxes presented in Table 1 and used to determine the PL and PW relationships through both classical and ABL methods (see Sect. 2.4) have been corrected for the ZP offset based on Lindegren et al. (2021). Geometric and photogeometric distances from Bailer-Jones et al. (2021) already incorporate these corrections. In line with our previous works (Narloch et al. 2023, 2024), we examined the impact of these applied corrections by comparing the differences in ZPs between T2Cep PL and PW relations derived for the two distinct cases: correcting Gaia parallaxes using the ZP offset obtained from prescription of Groenewegen (2021) and leaving them uncorrected.
Determined coefficients of PL and PW relations for Galactic T2Ceps.
The mean parallax corrections calculated using the recipe from Groenewegen (2021) are approximately −28 μas and −25 μas for BL Her and W Vir stars, respectively, closely match the values from Lindegren et al. (2021, see Sect. 2.4). That implies minor differences in the recalculated PL and PW relation coefficients, with slopes and intercepts well within 1σ uncertainty. In the case where no parallax corrections are applied, the slopes remain within 1σ uncertainty; however, the intercepts differ more significantly, resulting in smaller ZPs. These shifts amount to approximately 0.16 mag for BL Her stars and 0.29 mag for W Vir stars (about 0.20 mag for the combined sample). The ZP discrepancy between the two types of variables may stem from the fact that W Vir stars in our sample are generally at greater distances than BL Her stars. The intercept shifts observed in T2Ceps are considerably larger than those seen in classical Cepheids (Narloch et al. 2023) or RR Lyr stars (Narloch et al. 2024). However, it is noteworthy that, particularly for the RR Lyr stars, all stars were located at much closer distances (within 3 kpc).
4.2. Comparison of the PL and PW relations with the literature
4.2.1. Comparison of the PL and PW relations in the Galactic globular clusters
Ngeow et al. (2022) published PL and PW relations for T2Ceps from 18 globular clusters in the gri bands, based on the Sloan–Pan-STARRS version of the Sloan photometric system. They as well used the reddening vectors from Green et al. (2019) to de-redden the brightnesses and calculate Wesenheit magnitudes. Therefore, we can directly compare their relationships with our findings derived using parallax method, as shown in Fig. 5. The slopes of our relations are slightly flatter than those presented by Ngeow et al. (2022). Nevertheless, they agree well within about 1σ uncertainty. However, there is a significant disagreement in the ZPs of the relationships on the level of approximately 0.2 − 0.4 mag. This discrepancy appears to be more pronounced in the PL relations than in the PW relations, suggesting that reddening might be a major contributing factor (but certainly not the only one) of an existing difference. To test this hypothesis, we adopted reddening values for the T2Ceps in our sample from a different sources to investigate their influence on the ZPs. The advantage of using Schlafly & Finkbeiner (2011) reddening map is that it provides values for each of our targets, unlike other maps, which may have limited distance ranges or incomplete sky coverage. We used the STILISM map to obtain reddening values of our T2Ceps. For stars located at distances not covered by the map, we adopted the maximum reddening value in their direction. For comparison purposes, we also used the Bayestar2019 3D reddening map. For stars without available reddening values, we assumed zero reddening. The PL relations derived using these new E(B − V) values are shown in Fig. 5 with green and blue dashed lines. These relations are consistent with each other and with our original results, although yield slightly flatter slopes. However, they exhibit even worse agreement with the relations from Ngeow et al. (2022), ruling out the adopted reddening as the primary source of the disagreement. It is also important to note at this point that the relationships from Ngeow et al. (2022) were derived using BL Her, W Vir, and RV Tau stars, thus covering a wider range of periods. In contrast, our calibrated relations for combined sample omit the RV Tau stars, which may contribute to the observed differences. Another issue that may have a significant impact on this comparison is the range of metallicity of the T2Ceps from our sample compared to the sample from Ngeow et al. (2022).
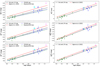 |
Fig. 5. Comparison of the PL and PW relations derived in this work for the combined sample of BL Her and W Vir stars (black lines) with the PL and PW relations determined by Ngeow et al. (2022, see their Tables 3 and 4) for T2Ceps from MW globular clusters (red lines). Dashed blue and dash-dot green lines in the left panels mark PL and PW relations derived using STILISM and Bayestar2019 reddening maps, respectively. |
4.2.2. Application to M31 T2Ceps
Kodric et al. (2018) provided average magnitudes in the Sloan–Pan-STARRS bands for 278 T2Ceps in the galaxy M31, which we used to test our calibrated relations. However, it is important to note that this comparison is problematic for a few reasons. First, the majority of T2Ceps measured by Kodric et al. (2018) are of the RV Tau type, while the remaining 68 stars could be classified as W Vir stars (assuming a 20 day period as the limit between W Vir and RV Tau stars; see, e.g., Soszyński et al. 2011). RV Tau-type stars exhibit nonlinear behavior in optical bands (see, e.g., Soszyński et al. 2008; Sicignano et al. 2024), so applying PL and PW relations derived solely from BL Her and W Vir stars to RV Tau stars is expected to underestimate the distance to the studied galaxy. To investigate this, we calculated Wesenheit magnitudes in the ri bands using reddened average magnitudes of M31 T2Ceps and reddening vectors from Green et al. (2019). Following Ngeow et al. (2022), we rejected six stars having period uncertainty larger than one day. Subsequently, we fitted our PW relation, derived using the parallax method for the combined sample (see Table 1), with fixed slope and allowing the ZP to vary as a free parameter (see Fig. 6). The resulting DM to M31 is 24.002 ± 0.058 mag. This value is significantly smaller than the DM of Li et al. (2021, equals to 24.407 ± 0.032 mag), calculated from classical Cepheids using Hubble Space Telescope data, or the value of 24.46 ± 0.10 mag recommended by de Grijs & Bono (2014). When fitting the same PW relation to W Vir stars only (with a fixed slope and intercept as a free parameter) we obtain μ = 24.253 ± 0.071 mag. Similarly, applying the PW relation from Table 1, specifically derived for W Vir stars and fitted to M31 W Vir stars, yields μ = 24.255 ± 0.108 mag. Both these values are smaller than the literature DM, revealing another potential problem, namely selection effect. Fainter W Vir stars in M31 may not have been detected by Kodric et al. (2018), leading us to fit the PW relations to only the brighter stars, which again shortens the inferred distance to M31. Another selection effect arises due to the very large halo size of M31 (as reported by, e.g., Ibata et al. 2014), which can cause stars lying on the far side of the galaxy (farther away from us, and hence fainter) to remain undetected. Consequently, the distance to the M31 measured based on T2Ceps predominantly located in the near side of its halo is likely underestimated. Another potential difficulty is that Kodric et al. (2018) do not distinguish pW Vir in their sample of T2Ceps. However, the presence of such stars among brighter objects within this range of periods is highly probable, as they are observed in other galaxies (see for example Fig. 4 from Soszyński et al. 2018). We inspected the light curves of the brightest variables classified as T2Ceps by Kodric et al. (2018) with periods of less than 20 days (i.e., in the range of W Vir stars). All of them have very similar light-curve shapes to pW Vir stars with similar periods in the OGLE catalogs of Magellanic Clouds variables. Therefore, this bias is certainly present in our distance estimates to M31.
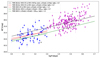 |
Fig. 6. PW relation for T2Ceps from Kodric et al. (2018) calculated using the reddening vectors from Green et al. (2019). Blue squares mark W Vir-type stars, magenta triangles mark RV Tau-type stars, and black crosses mark stars with period uncertainties larger than one day. Lines mark PW relations as defined by Eq. (2) for the combined sample of T2Ceps (solid lines) and solely W Vir stars (dashed lines). Green lines mark PW relations derived in this work, shifted by the DM from Li et al. (2021, μ = 24.407 mag). |
The above comparison and application of our PL and PW relations with the literature are not entirely satisfactory. Nevertheless, because of the reasons discussed, this does not imply that the relationships we calibrated in this work are incorrect. Instead, the comparison shows the complexities of using T2Ceps to determine distances, particularly in optical bands. This consideration will be important for future studies employing Rubin-LSST data.
4.2.3. Comparison of the PW relations for different types of pulsating stars
Figure 7 presents a comparison of PW relations (specifically for  ) for Galactic classical pulsators. These include relations derived by Narloch et al. (2023, for classical Cepheids pulsating in fundamental mode), Narloch et al. (2024, for RR Lyrae stars of RRab and RRc types), and those obtained in this work for T2Ceps. The plot closely resembles analogous optical/NIR relations for pulsating stars in the MW (e.g., Ripepi et al. 2019, 2023; Soszyński et al. 2017, 2020) as well as in other galaxies (e.g., Matsunaga et al. 2011; Soszyński et al. 2019). This figure summarizes our work on the PL relations of pulsating stars in the Sloan bands in our Galaxy using data from the LCO 40 cm telescopes, while also highlighting the potential for future research. In particular, increasing the sample sizes of RR Lyrae stars and T2Ceps would significantly improve the precision and reliability of these relationships.
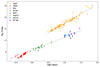 |
Fig. 7. Compilation of the PW relations for pulsating variables from the MW in the Sloan bands. Dashed gray lines are the PW relations derived for each type of variables in Narloch et al. (2023, for classical Cepheids), Narloch et al. (2024, for RR Lyrae stars), and this work (T2Ceps). |
5. Summary
In this work we calibrated the PL and PW relations for MW T2Ceps of BL Her and W Vir-types separately, as well as for the combined sample, in the Sloan–Pan-STARRS gP1rP1iP1 bands and Wesenheit indices Wrri, Wrgr, and Wggi. The obtained coefficients are presented in Table 1. To the best of our knowledge, these are the first such relations for T2Ceps in the vicinity of the Sun in these bands. Scientific images were collected with the 40 cm telescopes of the LCO Global Telescope Network in the g′r′i′ filters. The instrumental magnitudes were calibrated to the Sloan–Pan-STARRS version of the Sloan photometric system using the ATLAS-REFCAT2 catalog (Tonry et al. 2018). The obtained light curves, presented in Appendix C, were used to calculate intensity-averaged mean magnitudes, which are given in Table B.1. These include values for 16 BL Her stars and 17 W Vir stars, as well as three pW Vir stars, two RV Tau stars, and one first-overtone classical Cepheid. We adopted reddening values for all our targets from the reddening map of Schlafly & Finkbeiner (2011), and the extinction coefficients were taken from Green et al. (2019). The absolute magnitudes of our objects were calculated using four methods: the inverse of the Gaia DR3 parallaxes, the ABL method, and geometric and photogeometric distances from Bailer-Jones et al. (2021). Table 1 summarizes the results for all four methods. We manually excluded some stars from the calibration of the PL and PW relations due to reddening issues or likely incorrect Gaia DR3 parallax values (see Sect. 3.2).
We have discussed the influence of the ZP corrections by comparing the effects of applying those from Groenewegen (2021) instead of the ones provided by Lindegren et al. (2021), as well as the impact of not introducing any corrections (see Sect. 4.1). Finally, we compared our PL and PW relations for MW T2Ceps with those available in the literature for the Sloan–Pan-STARRS photometric system, namely Ngeow et al. (2022, for globular clusters) and Kodric et al. (2018, for T2Ceps in M31). The comparison of the slope values with those of Ngeow et al. (2022) shows good agreement; however, there is a significant difference in the ZPs (see Sect. 4.2). The distances to M31 calculated using the PW relations in the ri bands do not reproduce the DM derived from classical Cepheids (from Li et al. 2021), most likely for the reasons discussed in Sect. 4.2. This disagreement does not necessarily indicate an error in our relations but rather potential complications when using T2Ceps as distance indicators.
Data availability
Based on data from the Las Cumbres Observatory. The light curves are available at the CDS via anonymous ftp to cdsarc.cds.unistra.fr (130.79.128.5) or via https://cdsarc.cds.unistra.fr/viz-bin/cat/J/A+A/697/A30
The parallax ZP offset corrections for each star were derived using the dedicated Python code: https://gitlab.com/icc-ub/public/gaiadr3_zeropoint.
Updated maps are available at https://datalabs.esa.int/
Acknowledgments
We thank the anonymous referee for valuable comments which improved this paper. The research leading to these results has received funding from the European Research Council (ERC) under the European Union’s Horizon 2020 research and innovation program (grant agreement No. 951549 – UniverScale). We also acknowledge support from the Polish Ministry of Science and Higher Education grant DIR-WSIB.92.2.2024. We gratefully acknowledge financial support for this work from the BASAL Centro de Astrofisica y Tecnologias Afines (CATA) AFB-170002 and the Millenium Institute of Astrophysics (MAS) of the Iniciativa Cientifica Milenio del Ministerio de Economia, Fomento y Turismo de Chile, project IC120009. R.S. is supported by the National Science Center, Poland, Sonata BIS project 2018/30/E/ST9/00598. W.G. also gratefully acknowledges support from the ANID BASAL project ACE210002. P.W. gratefully acknowledges financial support from the Polish National Science Center grant PRELUDIUM 2018/31/N/ST9/02742. This work has made use of data from the European Space Agency (ESA) mission Gaia (https://www.cosmos.esa.int/gaia), processed by the Gaia Data Processing and Analysis Consortium (DPAC, https://www.cosmos.esa.int/web/gaia/dpac/consortium). Funding for the DPAC has been provided by national institutions, in particular the institutions participating in the Gaia Multilateral Agreement. Facilities: LCOGT (0.4 m). Software used in this work: gaiadr3_zero-point (Lindegren et al. 2021), IRAF (Tody 1986, 1993), DAOPHOT (Stetson 1987), Astropy (Astropy Collaboration 2013), Sklearn (Pedregosa et al. 2011) NumPy (van der Walt et al. 2011; Harris et al. 2020), SciPy (Virtanen et al. 2020), Matplotlib (Hunter 2007).
References
- Alcock, C., Allsman, R. A., Alves, D. R., et al. 1998, AJ, 115, 1921 [NASA ADS] [CrossRef] [Google Scholar]
- Arenou, F., & Luri, X. 1999, in Harmonizing Cosmic Distance Scales in a Post-HIPPARCOS Era, eds. D. Egret, & A. Heck, ASP Conf. Ser., 167, 13 [NASA ADS] [Google Scholar]
- Astropy Collaboration (Robitaille, T. P., et al.) 2013, A&A, 558, A33 [NASA ADS] [CrossRef] [EDP Sciences] [Google Scholar]
- Baade, W. 1944, ApJ, 100, 137 [NASA ADS] [CrossRef] [Google Scholar]
- Baade, W. 1956, PASP, 68, 5 [Google Scholar]
- Bailer-Jones, C. A. L., Rybizki, J., Fouesneau, M., Demleitner, M., & Andrae, R. 2021, AJ, 161, 147 [Google Scholar]
- Bhardwaj, A., Macri, L. M., Rejkuba, M., et al. 2017a, AJ, 153, 154 [NASA ADS] [CrossRef] [Google Scholar]
- Bhardwaj, A., Rejkuba, M., Minniti, D., et al. 2017b, A&A, 605, A100 [NASA ADS] [CrossRef] [EDP Sciences] [Google Scholar]
- Bhardwaj, A., Kanbur, S. M., Rejkuba, M., et al. 2022, A&A, 668, A59 [NASA ADS] [CrossRef] [EDP Sciences] [Google Scholar]
- Braga, V. F., Bhardwaj, A., Contreras Ramos, R., et al. 2018, A&A, 619, A51 [NASA ADS] [CrossRef] [EDP Sciences] [Google Scholar]
- Breuval, L., Kervella, P., Wielgórski, P., et al. 2021, The Astrophysical Journal, 913, 38 [Google Scholar]
- Capitanio, L., Lallement, R., Vergely, J. L., Elyajouri, M., & Monreal-Ibero, A. 2017, A&A, 606, A65 [NASA ADS] [CrossRef] [EDP Sciences] [Google Scholar]
- Das, S., Kanbur, S. M., Smolec, R., et al. 2021, MNRAS, 501, 875 [Google Scholar]
- Das, S., Molnár, L., Kanbur, S. M., et al. 2024, A&A, 684, A170 [NASA ADS] [CrossRef] [EDP Sciences] [Google Scholar]
- de Grijs, R., & Bono, G. 2014, AJ, 148, 17 [NASA ADS] [CrossRef] [Google Scholar]
- Dékány, I., Hajdu, G., Grebel, E. K., & Catelan, M. 2019, ApJ, 883, 58 [CrossRef] [Google Scholar]
- Di Criscienzo, M., Caputo, F., Marconi, M., & Cassisi, S. 2007, A&A, 471, 893 [NASA ADS] [CrossRef] [EDP Sciences] [Google Scholar]
- Drimmel, R., & Spergel, D. N. 2001, ApJ, 556, 181 [Google Scholar]
- Feast, M. W., & Catchpole, R. M. 1997, MNRAS, 286, L1 [NASA ADS] [CrossRef] [Google Scholar]
- Fukugita, M., Ichikawa, T., Gunn, J. E., et al. 1996, AJ, 111, 1748 [Google Scholar]
- Gaia Collaboration (Vallenari, A., et al.) 2023, A&A, 674, A1 [NASA ADS] [CrossRef] [EDP Sciences] [Google Scholar]
- Gieren, W., Pietrzynski, G., Bresolin, F., et al. 2005, The Messenger, 121, 23 [NASA ADS] [Google Scholar]
- Gingold, R. A. 1985, Mem. Soc. Astron. Ital., 56, 169 [Google Scholar]
- Green, G. M., Schlafly, E., Zucker, C., Speagle, J. S., & Finkbeiner, D. 2019, ApJ, 887, 93 [NASA ADS] [CrossRef] [Google Scholar]
- Groenewegen, M. A. T. 2021, A&A, 654, A20 [NASA ADS] [CrossRef] [EDP Sciences] [Google Scholar]
- Groenewegen, M. A. T., & Jurkovic, M. I. 2017, A&A, 604, A29 [NASA ADS] [CrossRef] [EDP Sciences] [Google Scholar]
- Groenewegen, M. A. T., Udalski, A., & Bono, G. 2008, A&A, 481, 441 [NASA ADS] [CrossRef] [EDP Sciences] [Google Scholar]
- Harris, H., Olszewski, E. W., & Wallerstein, G. 1979, AJ, 84, 1598 [Google Scholar]
- Harris, H. C., Olszewski, E. W., & Wallerstein, G. 1984, AJ, 89, 119 [Google Scholar]
- Harris, C. R., Millman, K. J., van der Walt, S. J., et al. 2020, Nature, 585, 357 [NASA ADS] [CrossRef] [Google Scholar]
- Hunter, J. D. 2007, Computing in Science and Engineering, 9, 90 [Google Scholar]
- Ibata, R. A., Lewis, G. F., McConnachie, A. W., et al. 2014, ApJ, 780, 128 [Google Scholar]
- Ivezić, Ž., Kahn, S. M., Tyson, J. A., et al. 2019, ApJ, 873, 111 [Google Scholar]
- Iwanek, P., Soszyński, I., Skowron, D., et al. 2018, Acta Astron., 68, 213 [NASA ADS] [Google Scholar]
- Joy, A. H. 1937, ApJ, 86, 363 [NASA ADS] [CrossRef] [Google Scholar]
- Joy, A. H. 1940, ApJ, 92, 396 [Google Scholar]
- Joy, A. H. 1949, ApJ, 110, 105 [Google Scholar]
- Kodric, M., Riffeser, A., Hopp, U., et al. 2018, AJ, 156, 130 [NASA ADS] [CrossRef] [Google Scholar]
- Lallement, R., Vergely, J. L., Valette, B., et al. 2014, A&A, 561, A91 [NASA ADS] [CrossRef] [EDP Sciences] [Google Scholar]
- Leavitt, H. S., & Pickering, E. C. 1912, Harvard College Observatory Circular, 173, 1 [Google Scholar]
- Lemasle, B., Kovtyukh, V., Bono, G., et al. 2015, A&A, 579, A47 [NASA ADS] [CrossRef] [EDP Sciences] [Google Scholar]
- Li, S., Riess, A. G., Busch, M. P., et al. 2021, ApJ, 920, 84 [NASA ADS] [CrossRef] [Google Scholar]
- Lindegren, L., Bastian, U., Biermann, M., et al. 2021, A&A, 649, A4 [EDP Sciences] [Google Scholar]
- Madore, B. F. 1982, ApJ, 253, 575 [NASA ADS] [CrossRef] [Google Scholar]
- Matsunaga, N., Fukushi, H., Nakada, Y., et al. 2006, MNRAS, 370, 1979 [Google Scholar]
- Matsunaga, N., Feast, M. W., & Menzies, J. W. 2009, MNRAS, 397, 933 [NASA ADS] [CrossRef] [Google Scholar]
- Matsunaga, N., Feast, M. W., & Soszyński, I. 2011, MNRAS, 413, 223 [Google Scholar]
- McAlary, C. W., & Welch, D. L. 1986, AJ, 91, 1209 [NASA ADS] [CrossRef] [Google Scholar]
- Narloch, W., Hajdu, G., Pietrzyński, G., et al. 2023, ApJ, 953, 14 [NASA ADS] [CrossRef] [Google Scholar]
- Narloch, W., Hajdu, G., Pietrzyński, G., et al. 2024, A&A, 689, A138 [NASA ADS] [CrossRef] [EDP Sciences] [Google Scholar]
- Ngeow, C.-C., Bhardwaj, A., Henderson, J.-Y., et al. 2022, AJ, 164, 154 [NASA ADS] [CrossRef] [Google Scholar]
- Pedregosa, F., Varoquaux, G., Gramfort, A., et al. 2011, Journal of Machine Learning Research, 12, 2825 [Google Scholar]
- Riess, A. G., Casertano, S., Yuan, W., et al. 2021, ApJ, 908, L6 [NASA ADS] [CrossRef] [Google Scholar]
- Ripepi, V., Moretti, M. I., Marconi, M., et al. 2015, MNRAS, 446, 3034 [NASA ADS] [CrossRef] [Google Scholar]
- Ripepi, V., Molinaro, R., Musella, I., et al. 2019, A&A, 625, A14 [NASA ADS] [CrossRef] [EDP Sciences] [Google Scholar]
- Ripepi, V., Clementini, G., Molinaro, R., et al. 2023, A&A, 674, A17 [NASA ADS] [CrossRef] [EDP Sciences] [Google Scholar]
- Schlafly, E. F., & Finkbeiner, D. P. 2011, ApJ, 737, 103 [Google Scholar]
- Schlegel, D. J., Finkbeiner, D. P., & Davis, M. 1998, ApJ, 500, 525 [Google Scholar]
- Sicignano, T., Ripepi, V., Marconi, M., et al. 2024, A&A, 685, A41 [NASA ADS] [CrossRef] [EDP Sciences] [Google Scholar]
- Simon, N. R., & Lee, A. S. 1981, ApJ, 248, 291 [NASA ADS] [CrossRef] [Google Scholar]
- Skowron, D. M., Skowron, J., Mróz, P., et al. 2019, Acta Astron., 69, 305 [NASA ADS] [Google Scholar]
- Soszyński, I., Udalski, A., Szymański, M. K., et al. 2008, Acta Astron., 58, 293 [NASA ADS] [Google Scholar]
- Soszyński, I., Udalski, A., Pietrukowicz, P., et al. 2011, Acta Astron., 61, 285 [NASA ADS] [Google Scholar]
- Soszyński, I., Udalski, A., Szymański, M. K., et al. 2017, Acta Astron., 67, 297 [NASA ADS] [Google Scholar]
- Soszyński, I., Udalski, A., Szymański, M. K., et al. 2018, Acta Astron., 68, 89 [NASA ADS] [Google Scholar]
- Soszyński, I., Smolec, R., Udalski, A., & Pietrukowicz, P. 2019, ApJ, 873, 43 [CrossRef] [Google Scholar]
- Soszyński, I., Udalski, A., Szymański, M. K., et al. 2020, Acta Astron., 70, 101 [Google Scholar]
- Stetson, P. B. 1987, PASP, 99, 191 [Google Scholar]
- Suchomska, K., Graczyk, D., Smolec, R., et al. 2015, MNRAS, 451, 651 [Google Scholar]
- Tody, D. 1986, in Instrumentation in Astronomy VI, ed. D. L. Crawford, SPIE Conf. Ser., 627, 733 [NASA ADS] [CrossRef] [Google Scholar]
- Tody, D. 1993, in Astronomical Data Analysis Software and Systems II, eds. R. J. Hanisch, R. J. V. Brissenden, & J. Barnes, ASP Conf. Ser., 52, 173 [Google Scholar]
- Tonry, J. L., Stubbs, C. W., Lykke, K. R., et al. 2012, ApJ, 750, 99 [Google Scholar]
- Tonry, J. L., Denneau, L., Flewelling, H., et al. 2018, ApJ, 867, 105 [NASA ADS] [CrossRef] [Google Scholar]
- van der Walt, S., Colbert, S. C., & Varoquaux, G. 2011, Computing in Science and Engineering, 13, 22 [Google Scholar]
- Vinko, J., Szabados, L., & Szatmary, K. 1993, A&A, 279, 410 [Google Scholar]
- Virtanen, P., Gommers, R., Oliphant, T. E., et al. 2020, Nature Methods, 17, 261 [CrossRef] [Google Scholar]
- Wielgórski, P., Pietrzyński, G., Pilecki, B., et al. 2022, The Astrophysical Journal, 927, 89 [Google Scholar]
Appendix A: Fourier analysis of Type II Cepheids
We analyzed gP1-band light curves of stars from our sample with Fourier analysis in order to confirm their classification into a certain group of pulsating stars. The derived parameters, including relative amplitudes and Fourier phases of harmonics (Simon & Lee 1981) are listed in Table A.1 and shown in Fig. A.1. We compared obtained diagrams with analogous diagrams from Soszyński et al. (2008) and Soszyński et al. (2018) for the Magellanic Clouds, as well as Soszyński et al. (2017) and Soszyński et al. (2020) for the Galactic disk and bulge for the reference. In Fig. A.1, BL Her-type stars are marked with circles, while W Vir-type stars are marked with squares. Different types of pulsating stars are represented with different colors. The pW Vir-type stars (marked with blue squares) clearly deviate from the rest of the T2Ceps, particularly in the ϕ21 parameter. Stars manually rejected from the fitting of the PL and PW relations (except DD Vel and AU Peg, which were rejected from the PL relation only) are marked with red squares. Their Fourier parameters seem to confirm their classification as W Vir-type stars, which suggests that their deviation from the relation is not due to misclassification but rather due to the reasons mentioned in the Sect. 3.
Fourier parameters determined for stars from our sample based on gP1-band light curves.
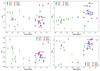 |
Fig. A.1. Fourier parameters from the analysis of gP1-band light curves of stars from our sample as a function of literature periods. |
Appendix B: Sample of Type II Cepheids
Table B.1 summarizes the parameters of all MW Type II Cepheids from our sample.
Sample of the MW Type II Cepheids and their main parameters.
Appendix C: The Sloan band light curves of Galactic Type II Cepheid stars analyzed in this work
Figure C.1 presents the Sloan gP1rP1iP1 bands light curves of 16 BL Her-type stars used in this study, while Fig. C.2 shows same light curves for 17 W Vir-type stars. Figure C.3 shows the light curves of other types of variables classified in this work (one first-overtone Type I Cepheid, three pW Vir and two RV Tau). The presented light curves are available at the webpage of the Araucaria Project: https://araucaria.camk.edu.pl/ and the CDS.
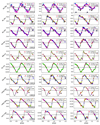 |
Fig. C.1. Sloan–Pan-STARRS gP1rP1iP1 band light curves of the BL Her-type T2Cep stars analyzed in this work. Horizontal dashed black lines correspond to the determined mean magnitudes. Different colors indicate the different telescopes used during the data collection, while black crosses mark points rejected from the fitting. Black lines show the best-fit Fourier series. |
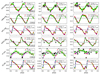 |
Fig. C.1. Continued. |
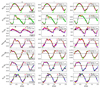 |
Fig. C.2. Continued. |
All Tables
Fourier parameters determined for stars from our sample based on gP1-band light curves.
All Figures
|
Fig. 1. Location of the T2Ceps – BL Her-types (circle) and W Vir-types (squares) – used to establish the PL relations in this paper given in Galactic coordinates, as well as other types of variables originally observed for the project and reclassified later – pW Vir types (diamonds), RV Tau types (triangles), and a Type I first-overtone Cepheid (star). |
| In the text | |
|
Fig. 2. PL relations for T2Ceps based on the reddening values from Schlafly & Finkbeiner (2011) and reddening vectors (Rλ) from Green et al. (2019). We show the BL Her- and W Vir-type stars adopted for the derivation of PL relations (filled circles and squares); stars with RUWE > 1.4 (open marks); stars manually rejected from the fit (red crosses; see Sect. 3 for an explanation); a first-overtone Type I Cepheid (yellow star); pW Vir-type stars (cyan diamonds), RV Tau-type stars (magenta triangles), the fit to Eq. (1) for BL Her and W Vir stars separately as well as combined (solid line), analogous fit to Eq. (3) (dashed line), and the ±3rms for BL Her and W Vir stars and the combined sample (shaded areas). The pivot logarithms of log P0 = 0.3, 1.2, 0.7 were used to fit the BL Her, W Vir, and combined sample, respectively. |
| In the text | |
|
Fig. 3. PW relations for T2Ceps. Wesenheit indices were calculated using the reddening vectors (Rλ) from Green et al. (2019). We show BL Her and W Vir-type stars adopted for derivation of PW relations (filled circles and squares); stars with RUWE > 1.4 (open marks); stars manually rejected from the fit (red crosses; see Sect. 3 for an explanation); a first-overtone Type I Cepheid (yellow star); pW Vir-type stars (cyan diamonds), RV Tau-type stars (magenta triangles), the fit to Eq. (2) for BL Her and W Vir stars separately, as well as combined (solid lines), analogous fit to Eq. (4) (dashed line); and the ±3rms for BL Her and W Vir stars and combined sample (shaded areas). The pivot logarithms of log P0 = 0.3, 1.2, 0.7 were used to fit the BL Her, W Vir, and combined sample, respectively. |
| In the text | |
|
Fig. 4. Color index (g − i) of T2Ceps from the MW as a function of the logarithm of the pulsational period (left panel) and the color–magnitude diagram from those stars (right panel). |
| In the text | |
|
Fig. 5. Comparison of the PL and PW relations derived in this work for the combined sample of BL Her and W Vir stars (black lines) with the PL and PW relations determined by Ngeow et al. (2022, see their Tables 3 and 4) for T2Ceps from MW globular clusters (red lines). Dashed blue and dash-dot green lines in the left panels mark PL and PW relations derived using STILISM and Bayestar2019 reddening maps, respectively. |
| In the text | |
|
Fig. 6. PW relation for T2Ceps from Kodric et al. (2018) calculated using the reddening vectors from Green et al. (2019). Blue squares mark W Vir-type stars, magenta triangles mark RV Tau-type stars, and black crosses mark stars with period uncertainties larger than one day. Lines mark PW relations as defined by Eq. (2) for the combined sample of T2Ceps (solid lines) and solely W Vir stars (dashed lines). Green lines mark PW relations derived in this work, shifted by the DM from Li et al. (2021, μ = 24.407 mag). |
| In the text | |
|
Fig. 7. Compilation of the PW relations for pulsating variables from the MW in the Sloan bands. Dashed gray lines are the PW relations derived for each type of variables in Narloch et al. (2023, for classical Cepheids), Narloch et al. (2024, for RR Lyrae stars), and this work (T2Ceps). |
| In the text | |
|
Fig. A.1. Fourier parameters from the analysis of gP1-band light curves of stars from our sample as a function of literature periods. |
| In the text | |
|
Fig. C.1. Sloan–Pan-STARRS gP1rP1iP1 band light curves of the BL Her-type T2Cep stars analyzed in this work. Horizontal dashed black lines correspond to the determined mean magnitudes. Different colors indicate the different telescopes used during the data collection, while black crosses mark points rejected from the fitting. Black lines show the best-fit Fourier series. |
| In the text | |
|
Fig. C.1. Continued. |
| In the text | |
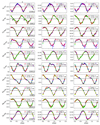 |
Fig. C.2. Same as Fig. C.1 but for the W Vir-type T2Cep stars. |
| In the text | |
|
Fig. C.2. Continued. |
| In the text | |
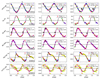 |
Fig. C.3. Same as Fig. C.1 but for variables of other types (Cepheid 1O, pW Vir, and RV Tau). |
| In the text | |
Current usage metrics show cumulative count of Article Views (full-text article views including HTML views, PDF and ePub downloads, according to the available data) and Abstracts Views on Vision4Press platform.
Data correspond to usage on the plateform after 2015. The current usage metrics is available 48-96 hours after online publication and is updated daily on week days.
Initial download of the metrics may take a while.