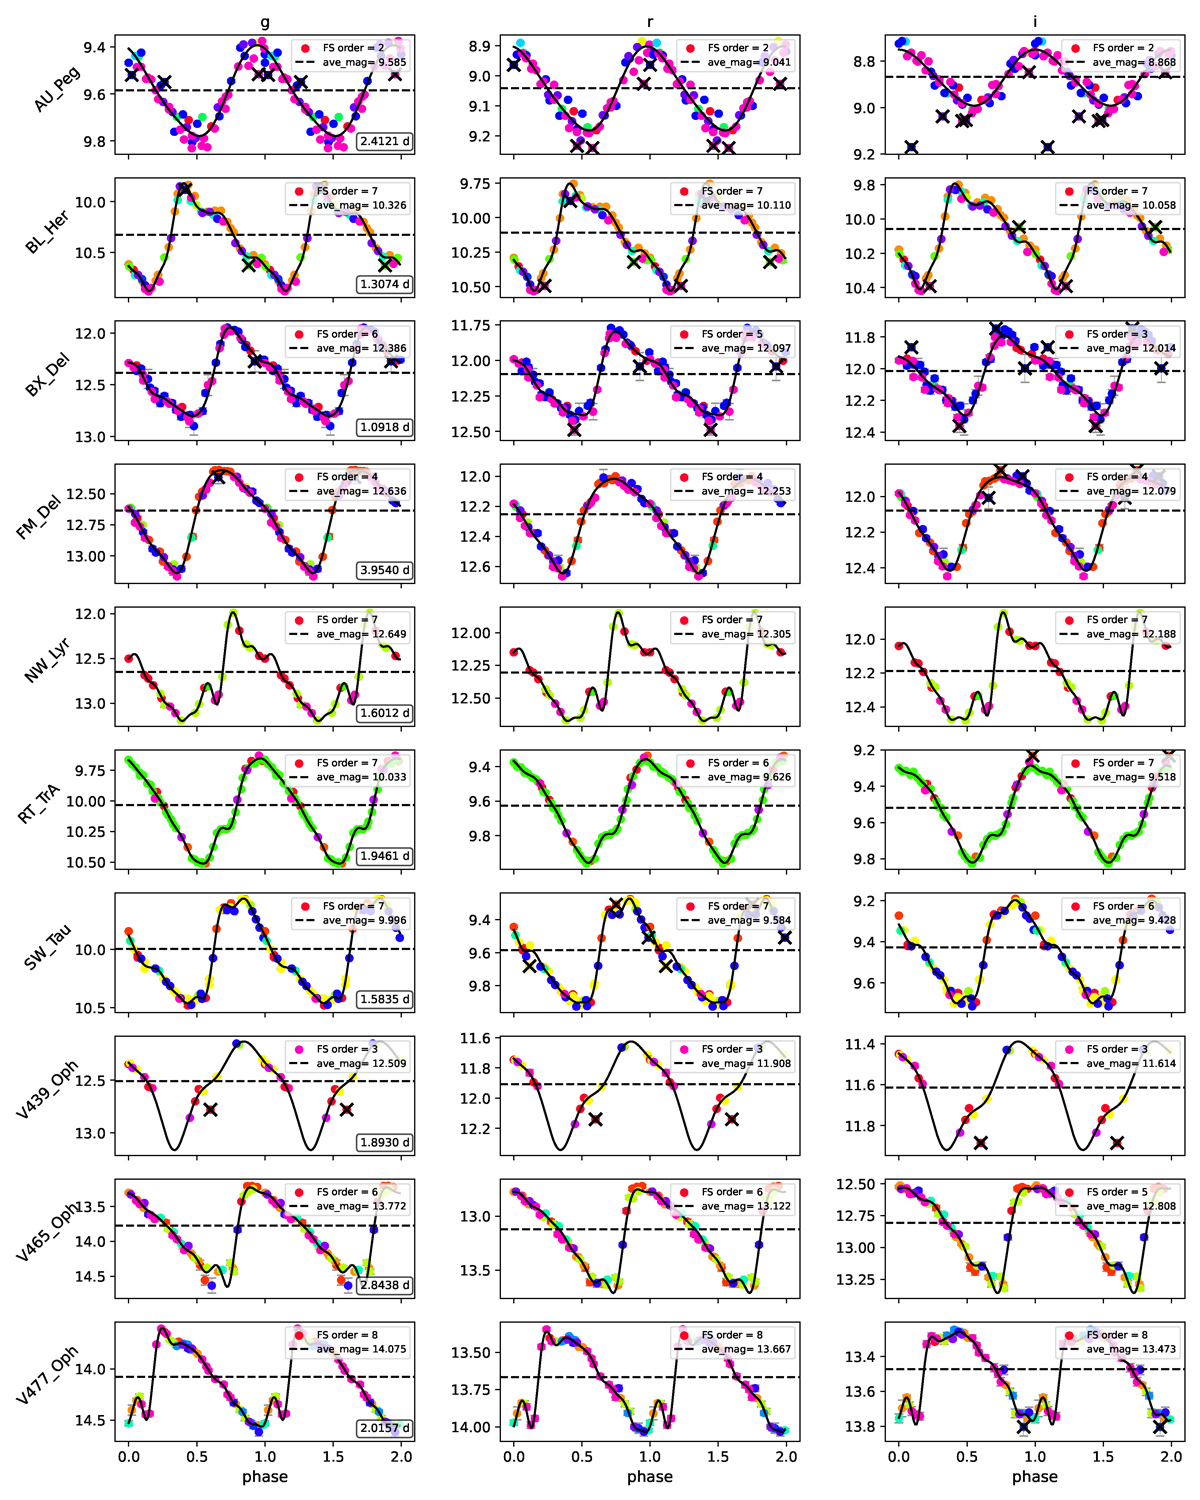
Fig. C.1.
Download original image
Sloan–Pan-STARRS gP1rP1iP1 band light curves of the BL Her-type T2Cep stars analyzed in this work. Horizontal dashed black lines correspond to the determined mean magnitudes. Different colors indicate the different telescopes used during the data collection, while black crosses mark points rejected from the fitting. Black lines show the best-fit Fourier series.
Current usage metrics show cumulative count of Article Views (full-text article views including HTML views, PDF and ePub downloads, according to the available data) and Abstracts Views on Vision4Press platform.
Data correspond to usage on the plateform after 2015. The current usage metrics is available 48-96 hours after online publication and is updated daily on week days.
Initial download of the metrics may take a while.