| Issue |
A&A
Volume 695, March 2025
|
|
|---|---|---|
| Article Number | A38 | |
| Number of page(s) | 20 | |
| Section | Stellar structure and evolution | |
| DOI | https://doi.org/10.1051/0004-6361/202452465 | |
| Published online | 03 March 2025 | |
A theoretical framework for BL Her stars
IV. New period-luminosity relations in the Rubin-LSST filters
1
Konkoly Observatory, HUN-REN Research Centre for Astronomy and Earth Sciences, Konkoly-Thege Miklós út 15-17, H-1121 Budapest, Hungary
2
CSFK, MTA Centre of Excellence, Konkoly Thege Miklós út 15-17. H-1121, Budapest, Hungary
3
Inter-University Center for Astronomy and Astrophysics (IUCAA), Post Bag 4, Ganeshkhind, Pune 411007 India
4
ELTE Eötvös Loránd University, Institute of Physics and Astronomy, 1117, Pázmány Péter sétány 1/A, Budapest, Hungary
5
Department of Physics & Astrophysics, University of Delhi, Delhi 110007, India
6
Department of Physics, State University of New York Oswego, Oswego, NY 13126, USA
7
INAF-Osservatorio Astronomico di Capodimonte, Salita Moiariello 16, 80131 Naples, Italy
8
Nicolaus Copernicus Astronomical Center, Polish Academy of Sciences, Bartycka 18, PL-00-716 Warsaw, Poland
⋆ Corresponding author; This email address is being protected from spambots. You need JavaScript enabled to view it.
Received:
2
October
2024
Accepted:
11
January
2025
Abstract
Context. The upcoming Rubin-LSST is expected to revolutionize the field of classical pulsators by offering well-sampled multi-epoch photometric data in multiple wavelengths. Type II Cepheids (T2Cs) exhibit weak or negligible metallicity dependence on period-luminosity (PL) relations. Thus, they may potentially be used as an alternative to classical Cepheids for extragalactic distance estimations, when used together with RR Lyraes and the tip of the red giant branch. It is therefore crucial to study an updated theoretical pulsation scenario of BL Herculis stars (BL Her; the shortest period T2Cs) in the corresponding Rubin-LSST photometric system.
Aims. We present new theoretical light curves in the Rubin-LSST filters for a fine grid of BL Her models computed using MESA-RSP. We have also derived new theoretical PL and period-Wesenheit (PW) relations in the Rubin-LSST filters with the aim to study the effect of convection parameters and metallicity on these relations.
Methods. The grid of BL Her models was computed using the non-linear radial stellar pulsation tool MESA-RSP with the input stellar parameters: metallicity (−2.0 dex ≤ [Fe/H] ≤ 0.0 dex), stellar mass (0.5 M⊙ − 0.8 M⊙), stellar luminosity (50 L⊙ − 300 L⊙), and effective temperature (across the full extent of the instability strip; in steps of 50 K) and using four sets of convection parameters. Bolometric correction tables from MIST were used to transform the theoretical bolometric light curves of the BL Her models into the Rubin–LSST ugrizy filters.
Results. The PL relations of the BL Her models exhibit steeper slopes but smaller dispersion with increasing wavelengths in the Rubin-LSST filters. The PL and PW slopes for the complete set of BL Her models computed with radiative cooling (sets B and D) are statistically similar across the grizy filters. The BL Her models exhibit weak or negligible effect of metallicity on the PL relations for wavelengths longer than the g filter for the case of the complete set of models as well as for the low-mass models. However, we find a significant effect of the metallicity on the PL relation in the u filter. Strong metallicity effects are observed in the PWZ relations involving the u filter and are found to have significant contribution from the high-metallicity BL Her models. Due to a negligible metallicity effect for relations involving the Wesenheit indices W(i, g − i), W(z, i − z), and W(y, g − y), we recommend these filter combinations for BL Her stars during observations with Rubin–LSST for use as reliable standard candles.
Key words: hydrodynamics / methods: numerical / stars: low-mass / stars: oscillations / stars: Population II / stars: variables: Cepheids
© The Authors 2025
 Open Access article, published by EDP Sciences, under the terms of the Creative Commons Attribution License (https://creativecommons.org/licenses/by/4.0), which permits unrestricted use, distribution, and reproduction in any medium, provided the original work is properly cited.
This article is published in open access under the Subscribe to Open model. This email address is being protected from spambots. You need JavaScript enabled to view it. to support open access publication.
1. Introduction
BL Herculis (BL Her) stars belong to the class of Type II Cepheids (T2Cs), which lie between RR Lyraes and classical Cepheids on the instability strip of the Hertzsprung-Russell diagram (HRD, Gingold 1985; Wallerstein 2002; Bono et al. 2024). BL Her stars are typically considered to be low-mass stars (Bono et al. 1997; Caputo 1998; Bono et al. 2020) with pulsation periods between 1 and 4 days (Soszyński et al. 2018). It is important to note that both the lower and the upper limits on pulsation period are not strict. The pulsation period of 1 day separates RR Lyraes and T2Cs (Soszyński et al. 2008, 2014); however, the RR Lyrae–T2C separation is a long-standing problem and is now recommended to be separated on a more general evolution-dependent threshold (Braga et al. 2020; Bono et al. 2024). An in-depth analysis of the light curve morphology of these classical pulsators may also be useful in this regard (see, e.g., Fig. 9 of Smolec et al. 2018). On the other hand, the upper limit of the pulsation period of BL Her stars is 4 days in the Magellanic Clouds (Soszyński et al. 2018) but 5 days in the Galactic bulge (Soszyński et al. 2017), depending on the stellar environment. However, in this study, we consider the conventional classification of pulsation periods 1 ≤ P(days)≤4 for BL Her stars.
BL Her stars (and T2Cs) obey well-defined period-luminosity (PL) relations (Matsunaga et al. 2006, 2009, 2011; Groenewegen et al. 2008; Ciechanowska et al. 2010; Ripepi et al. 2015; Bhardwaj et al. 2017a,b; Groenewegen & Jurkovic 2017; Braga et al. 2018; Bhardwaj et al. 2022; Ngeow et al. 2022; Sicignano et al. 2024), similar to RR Lyrae stars (in near-infrared) and classical Cepheids. Therefore, they can serve as useful distance estimators (see reviews, Beaton et al. 2018; Bhardwaj 2020; Bono et al. 2024). However, BL Her stars seem to have an advantage over the other classical pulsators with their weak or negligible effect of metallicity on the PL relations, as demonstrated by the empirical studies mentioned above and complemented by theoretical studies (Di Criscienzo et al. 2007; Das et al. 2021, 2024). Recently, several new T2Cs have been detected towards the Galactic center (Braga et al. 2019) as well as from the VIrac VAriable Classification Ensemble (VIVACE) catalogue (Molnar et al. 2022) of the Vista Variables in the Vía Láctea (VVV) infrared survey of the Galactic bar and bulge, and the southern disc. In addition, Wielgórski et al. (2024) recently determined projection factors for eight nearby BL Her stars and calibrated the semi-geometric Baade-Wesselink method (Baade 1926; Becker & Strohmeier 1940; Wesselink 1947) for measuring distances using BL Her stars.
We present this paper in anticipation of the upcoming Vera C. Rubin Observatory Legacy Survey of Space and Time (Rubin–LSST)1, which is expected to revolutionize the field of stellar astrophysics (and in particular, classical pulsators). The new ground-based telescope is expected to detect stars at limiting magnitudes of around 25 mag2, thereby producing unprecedented astronomical data of the deep universe. The Rubin–LSST will observe the southern sky in six filters uLSST, gLSST, rLSST, iLSST, zLSST, and yLSST (hereafter ugrizy) and it will allow us to obtain well-sampled multi-epoch photometry of the classical pulsators, among other astronomical data. We therefore provide multi-band theoretical PL relations of BL Her models in the Rubin–LSST filters for a future comparison with observations, as was recently done by Marconi et al. (2022) for RR Lyrae models.
We used the fine grid of convective BL Her models first presented in Das et al. (2021) (hereafter Paper I), which was subsequently used in Das et al. (2024) and Das et al. (2025) (hereafter Paper II and Paper III, respectively). The grid of models was computed using the state-of-the-art 1D non-linear Radial Stellar Pulsation (RSP) tool within the Modules for Experiments in Stellar Astrophysics (MESA, Paxton et al. 2011, 2013, 2015, 2018, 2019; Jermyn et al. 2023) software suite for a wide range of input parameters: metallicity (−2.0 dex ≤ [Fe/H] ≤ 0.0 dex), stellar mass (0.5–0.8 M⊙), stellar luminosity (50–300 L⊙), and effective temperature (full extent of the instability strip; in steps of 50 K) and using four sets of convection parameters as outlined in Paxton et al. (2019). We presented new theoretical PL relations for BL Her models in the Johnson-Cousins-Glass bands (UBVRIJHKLL′M) in Paper I and in the Gaia passbands (G, GBP, and GRP) in Paper II and compared with the empirical relations at mean light from Matsunaga et al. (2006, 2009, 2011), Bhardwaj et al. (2017b), Groenewegen & Jurkovic (2017), Ripepi et al. (2023). Among the most interesting results is the weak or negligible metallicity effect on the theoretical PL relations in wavelengths longer than the B band, as observed in the empirical relations. In Paper III, we carried out a robust light curve optimisation technique to compare stellar pulsation BL Her models computed using MESA-RSP with observed light curves. We applied the technique to 58 BL Her stars in the Large Magellanic Cloud from Gaia DR3 over their entire pulsation cycle and not just at mean light.
As an extension to Paper I and Paper II, here we compute the light curves for the fine grid of BL Her models in the Rubin–LSST filters (ugrizy), derive new multi-band theoretical PL relations, and study the effects of metallicity and convection parameters. The structure of this paper is as follows: in Sect. 2, we present the theoretical light curves of the BL Her models, spanning a wide range of stellar mass, stellar luminosity, metallicities, and effective temperatures across the four sets of convection parameters in the Rubin–LSST filters. In Sect. 3, we derive the theoretical PL relations in the ugrizy filters and study the effect of metallicity and convection parameters on these relations. A comparison of the PL relations of BL Her models with those from RR Lyrae models (Marconi et al. 2022) in the Rubin–LSST filters is described out in Sect. 4. Lastly, the results of this study are summarized in Sect. 5.
2. Theoretical light curves in the Rubin–LSST filters
2.1. Stellar pulsation models
We used the grid of non-linear radial stellar pulsation BL Her models computed using MESA-RSP (Smolec & Moskalik 2008; Paxton et al. 2019) in Paper I. In brief, the grid of BL Her models covers: (i) seven metallicities (Z = 0.00014, 0.00043, 0.00061, 0.00135, 0.00424, 0.00834, 0.013; see Table A.1 for more details); (ii) stellar masses M/ M⊙ ∈ ⟨0.5,0.8⟩ with a step of 0.05 M⊙; (iii) stellar luminosities L/L⊙ ∈ ⟨50,300⟩3 with a step of 50 L⊙; and (iv) effective temperatures, Teff ∈ ⟨4000,8000⟩ K, with a step of 50 K. Each grid with these ZXMLTeff input stellar parameters was computed using the four sets of convection parameters (sets A, B, C, and D), each with increasing complexity, as outlined in Table 4 of Paxton et al. (2019). The non-linear computations for the grid of models with the above-mentioned input stellar parameters and convective efficiencies were carried for 4000 pulsation cycles each. Thus, we also checked for the conditions of full-amplitude stable pulsation4 and single periodicity. Following the above checks and considering only those models with non-linear pulsation periods between 1–4 days to be BL Her models (Soszyński et al. 2018), the number of BL Her models accepted in each convection set are as follows: 3266 (set A), 2260 (set B), 2632 (set C), and 2122 (set D).
It is important to highlight here that our grid of models includes stellar masses higher than what is typically considered for BL Her stars (for more discussion, see Das et al. 2021, 2024). BL Her stars are predicted to be low-mass stars and in a double-shell (hydrogen and helium) burning phase (Salaris & Cassisi 2005), as they evolve off the zero-age horizontal branch and approach their asymptotic giant branch (AGB) track (Gingold 1985; Bono et al. 1997; Caputo 1998; Bono et al. 2020; Braga et al. 2020; Bono et al. 2024). The higher stellar mass (M > 0.6 M⊙) and lower metallicity (Z = 0.00014) models may also be considered typical of evolved RR Lyrae stars. However, as mentioned in Paper I and Paper II, we chose to explore the possibility of higher stellar mass models following a few theoretical studies on BL Her stars (Marconi & Di Criscienzo 2007; Smolec & Moskalik 2012) as well as to accommodate the differences in the uncertainties between different evolutionary codes. In Paper III, we indeed found the majority of observed BL Hers in the LMC to match well with the lower stellar mass models (M ≤ 0.65 M⊙), with just a few preferring the higher stellar mass models. In light of this, for a reliable comparison with future observations from the Rubin–LSST, we derived the PL relations and carry out the theoretical analysis twice: for the complete set of BL Her models with M/ M⊙ ∈ [0.5, 0.8] as well as for the low-mass models only with M/ M⊙ ∈ [0.5, 0.6].
2.2. Processing the model data
The non-linear computations of the models using MESA-RSP result in bolometric light curves, which can then be transformed into light curves in different passbands (for more details, see, Paxton et al. 2018). While MESA includes a few pre-computed bolometric correction (BC) tables, it does not yet include BC tables to transform the bolometric light curves into the different Rubin–LSST filters. As in Paper II, we therefore include user-provided BC tables defined as a function of the stellar photosphere in terms of Teff (K), log(g(cm s−2)), and metallicity [M/H]. We use BC tables obtained from the MIST5 (MESA Isochrones & Stellar Tracks) packaged model grids which were computed using 1D atmosphere models (based on ATLAS12/SYNTHE; Kurucz 1970, 1993); thereby transforming the theoretical bolometric light curves of our grid of BL Her models into the Rubin–LSST ugrizy filters. A few examples of the theoretical light curves of BL Her models in the Rubin-LSST filters computed using convection parameter set A are presented in Fig. 1. The theoretical BL Her light curves in the Rubin-LSST filters across the different convection parameter sets are available upon request.
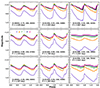 |
Fig. 1. Theoretical light curves of a few BL Her models in the Rubin-LSST filters computed using convection parameter set A. The input stellar parameters of the corresponding models are included in the format (Z, M/ M⊙, L/L⊙, Teff) in each sub-plot. The increasing stellar luminosity (L/L⊙) are plotted from the bottom to the top panels, while the increasing effective temperature values (Teff) are displayed from the right to the left panels. |
Instead of using a simple mean magnitude to obtain the PL relations in the different filters, we used the mean magnitudes obtained by fitting the theoretical light curves in the Rubin–LSST filters with the Fourier sine series (see, for example, Deb & Singh 2009; Das et al. 2020), taking the form:
 (1)
(1)
where x is the instantaneous pulsation phase, m0 is the mean magnitude, and N is the order of the fit (N = 20). We also obtain the peak-to-peak amplitude A of the light curve as the difference in the minimum and the maximum of the light variations:
 (2)
(2)
where (Mλ)min and (Mλ)max are the minimum and maximum magnitudes obtained from the Fourier fits in the λ band, respectively. The input stellar parameters as well as the computed light curve parameters of the BL Her models in the different Rubin–LSST filters obtained from the Fourier fitting and used in this analysis are provided in Table 1.
Light curve parameters of the BL Her models used in this analysis computed using MESA-RSP.
From both Fig. 1 and Table 1, we find that the peak-to-peak amplitude of the light curve of a particular BL Her model decreases with increasing wavelength as we go from the u to the y filters. This is well-known and is expected because the effective temperature of a BL Her star (similar to RR Lyraes and classical Cepheids) causes the Planck function to peak at visible wavelengths with the temperature dependence of visible flux scaling as R2Teff4. The temperature dependence of infrared flux, on the other hand, lies in the Rayleigh-Jeans tail of the Planck function and scales as R2Teff1.6 (Jameson 1986; Catelan & Smith 2015; Das et al. 2018). This is probed further in the Bailey diagram (peak-to-peak amplitude versus period) as a function of stellar mass, chemical composition, and wavelength (displayed in Fig. B.1). As discussed earlier, the amplitude decreases with increasing wavelength. However, a higher stellar mass model exhibits a slightly higher amplitude at a particular wavelength. We also found a significantly larger amplitude for the higher metallicity model, corresponding to the same stellar mass and luminosity; this is more pronounced at the shorter wavelengths (uLSST and gLSST). Similar results hold for all four sets of convection parameters.
3. Period-luminosity relations
The theoretical period-luminosity (PL) relations of the BL Her models in the Rubin–LSST filters are derived using the mathematical form:
 (3)
(3)
where Mλ refers to the mean magnitudes obtained from the Fourier-fitted theoretical light curves in a given band, λ. We note that a few empirical and theoretical studies use intensity-averaged magnitudes, which may result in slightly different PL relations, especially at the shorter wavelengths.
In addition, we used Wesenheit indices (Madore 1982), which offer the advantage of being minimally affected by uncertainties arising from extinction corrections. The Wesenheit magnitude combinations adopted for this work come from Marconi et al. (2022) and are defined as follows:
 (4)
(4)
Here, ugrizy are the absolute mean magnitudes in the respective Rubin-LSST filters. The color term coefficients result from the extinction law by Cardelli et al. (1989), assuming RV = 3.1. Thus, we also derived theoretical multi-filter period-Wesenheit (PW) relations of the BL Her models of the mathematical form:
 (5)
(5)
where λ1 > λ2 and the multi-filter Wesenheit indices Wλ2, λ1 are obtained from Eq. (4).
3.1. Effect of convection parameters
We used the standard t-test6 to statistically compare the slopes of the theoretical PL and PW relations across the different convection parameter sets to study the effect of convection efficiencies on these relations. We note that the t-test is relatively robust to deviations from assumptions (see e.g. Posten 1984).
The theoretical PL and PW relations for the BL Her models in the Rubin-LSST filters and the results from the standard t-test across the different convection parameter sets are presented in Tables C.1 and C.2, respectively. For the complete set of BL Her models, the slopes of the PL and PW relations for the models computed with radiative cooling (sets B and D) are statistically similar across all the Rubin-LSST filters longer than the u filter. We found similar results in Paper I for the Johnson-Cousin-Glass bands (BVRIJHKLL′M) and in Paper II across all the Gaia passbands. However, for the low-mass BL Her models, the theoretical PL relations computed using convection parameter sets A, C, and D exhibit statistically similar slopes across most of the Rubin–LSST filters while the PW slopes are only statistically similar for models computed with sets A and D. This result is similar to what we found in Paper II for the Gaia passbands.
In increasing order of their central effective wavelengths (λeff), the Rubin–LSST filters follow the order of u < g < r < i < z < y (Rodrigo et al. 2012; Rodrigo & Solano 2020). Table C.1 demonstrates that theoretical PL slopes get steeper in the Rubin-LSST filters with increasing wavelengths, similar to what was found in Paper I for the Johnson-Cousin-Glass bands (UBVRIJHKLL′M) and in Paper II for the Gaia passbands (GGBPGRP). This trend is also observed in empirical PL relations for RR Lyrae stars (Neeley et al. 2017; Beaton et al. 2018; Bhardwaj 2020, among others). The dispersion in the theoretical PL relations for BL Her models also decreases with increasing wavelengths in the Rubin-LSST filters and is expected to be caused by the very decrease in the width of the instability strip itself with increasing wavelengths (for more details, see, Catelan et al. 2004; Madore & Freedman 2012; Marconi et al. 2015).
3.2. Effect of metallicity
As mentioned earlier, the weak or negligible metallicity effect on the PL relations of BL Her stars from theoretical and empirical studies so far seem to offer an advantage over the classical pulsators. RR Lyrae and classical Cepheid stars suffer from strong metallicity effects on their PL relations, especially at shorter wavelengths (see e.g. Ripepi et al. 2021, 2022; Breuval et al. 2022; De Somma et al. 2022; Bhardwaj et al. 2023). BL Her stars do thus potentially exhibit a universal PL relation irrespective of different stellar environments with different metallicities. It is therefore of crucial importance to also test the effect of metallicity on the theoretical relations in the Rubin-LSST filters. To this end, we derived PLZ and PWZ relations for the BL Her models in the Rubin-LSST filters, taking the mathematical form:
![Mathematical equation: $$ \begin{aligned} \begin{aligned} M_\lambda =&\ \alpha +\beta \log (P)+\gamma \mathrm{[Fe/H]} ; \\ W_{\lambda _2, \lambda _1} =&\ \alpha +\beta \log (P)+\gamma \mathrm{[Fe/H]} .\\ \end{aligned} \end{aligned} $$](/articles/aa/full_html/2025/03/aa52465-24/aa52465-24-eq8.gif) (6)
(6)
The theoretical PLZ relations of the BL Her models for the different Rubin–LSST filters across the different convection parameter sets are presented in Tables C.3 and C.4, and displayed in Fig. C.1. In Table C.3, the PLZ relations from both the complete set of models and from the low-mass models exhibit a weak or negligible effect of the metallicity (indicated by the γ term) on the PL relations for wavelengths longer than the g filter onwards (within 3σ uncertainties), with a significant metallicity effect in the u filter. This is very similar to the strong dependence of PL relations on metallicity that was observed in the U and B bands in Paper I. To investigate the significant metallicity dependence in the u filter, we derived PLZ relations for the BL Her models in Table C.4 in the low-metallicity (Z = 0.00014, 0.00043, 0.00061, 0.00135) and the high-metallicity (Z = 0.00424, 0.00834, 0.01300) regimes. We clearly see the significant metallicity contribution in the u filter arising mostly from the high-metallicity BL Her models with a much smaller dependence on metallicity from the low-metallicity BL Her models. This could be caused by the higher effect of metallicities on bolometric corrections at wavelengths shorter than the V band (Gray 2005; Kudritzki et al. 2008), which is discussed in more detail in Paper I and Paper II. A systematic study of the impact of the different model atmospheres adopted for the transformations of the bolometric light curves is crucial for constraining the stellar pulsation theory further, but is beyond the scope of the present study.
The equivalent multi-filter PWZ relations for the BL Her models are derived in Tables C.5 and C.6 and displayed in Fig. C.2. Strong metallicity effects are observed in the PWZ relations involving the u filter and are once again, significantly contributed by the high-metallicity BL Her models. The small but significant metallicity contribution in the Wgr relations in the presence of a weak or negligible metallicity effect on the PL relations in the g and r filters individually is interesting, but this is similar to what was also seen in Paper II for PW relations derived using Gaia passbands. The PWGaiaZ relations from the classical Cepheids also exhibit a relatively large metallicity dependence (see Ripepi et al. 2022; Breuval et al. 2022; Trentin et al. 2024). As in Paper II, the high-metallicity BL Her models exhibit a small but significant and negative metallicity coefficient in the PWgrZ relations, resulting in an overall small metallicity effect on the PWgrZ relations. An updated figure demonstrating the contribution of the γ term (metallicity effect) from the the theoretical PLZ relations for BL Her models across multiple wavelengths, including the Rubin-LSST filters (ugrizy) is presented in Fig. 2. This figure clearly exhibits weak or negligible metallicity effect on the PL relations for BL Her models for wavelengths longer than the V band. In addition, for wavelengths shorter than the V band, we found a much higher contribution of metallicity from the high-metallicity BL Her models that contribute to the overall metallicity dependence when the complete set of BL Her models is considered.
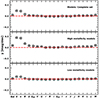 |
Fig. 2. Contribution of the γ term (metallicity effect) obtained from the theoretical PLZ relations for BL Her models computed using the convection parameter set A. Figure updated from Paper II to also include the Rubin–LSST filters (ugrizy) in addition to the bolometric (Bol), Johnson-Cousins-Glass (UBVRIJHKLL′M) and Gaia (GGBPGRP) passbands. The different panels present results from the complete set of models compared with the high-metallicity models (Z = 0.00424, 0.00834, 0.01300) and the low-metallicity models (Z = 0.00014, 0.00043, 0.00061, 0.00135). The x-axis is in increasing order of the central effective wavelengths (λeff) of the respective passbands as provided by the SVO Filter Profile Service (Rodrigo et al. 2012; Rodrigo & Solano 2020). |
In addition to Eq. (6), we also derived modified PLZ and PWZ relations for the BL Her models in the Rubin–LSST filters, taking the mathematical form:
![Mathematical equation: $$ \begin{aligned} \begin{aligned} M_\lambda =&\ \alpha +(\beta _1+\beta _2[Fe/H])\log (P)+\gamma \mathrm{[Fe/H]} ; \\ W_{\lambda _2, \lambda _1} =&\ \alpha +(\beta _1+\beta _2[Fe/H])\log (P)+\gamma \mathrm{[Fe/H].} \\ \end{aligned} \end{aligned} $$](/articles/aa/full_html/2025/03/aa52465-24/aa52465-24-eq9.gif) (7)
(7)
This allowed us to take into account the metallicity-dependent slopes predicted from the theoretical PL and PW relations involving the Rubin–LSST u filter. The modified PLZ and PWZ relations are presented in Tables D.1 and D.2, respectively, in the Appendix. For completeness, we also include the relations for all the Rubin–LSST filters. The dependence on metallicity for the Rubin–LSST u filter indeed seems to be weaker (but still significant considering 3σ uncertainties) when we use the modified PLZ/PWZ relations. Comparing results from the complete set of models using convection set A, we find that the metallicity term γ from the PLZ relation is 0.223 ± 0.009 (Table C.3); whereas from the modified PLZ relation, it is 0.125 ± 0.02 (Table D.1) in the Rubin-LSST u filter. Similar results are seen for the other convection sets, as well as for the case of low-mass models only. This is also true for the PWZ relations involving the Rubin–LSST u filter for all cases.
As was observed for the theoretical PW relations for RR Lyrae models in Marconi et al. (2022), a dependence of the metallicity effect on the band combinations is seen for BL Her models in this work. The metallicity effect is minimal for relations involving the Wesenheit indices Wgi, Wiz, and Wgy; therefore, we recommend using these filter combinations for BL Her stars to be used as reliable standard candles, when observed with the Rubin-LSST. This will take care of any uncertainties present in the spectroscopic metallicities of these stars.
4. Comparison with RRL models
Recent empirical studies by Majaess (2010), Bhardwaj et al. (2017a), and Braga et al. (2020) have found evidence that RRab stars and T2Cs obey the same PL relations at near-infrared wavelengths. This is not surprising given that both classes are population II classical pulsators having similar chemical compositions, with the classical evolutionary scenario often suggesting BL Her stars to be the evolved counterparts of RR Lyrae stars as they evolve from the blue ZAHB and approach their AGB tracks (Gingold 1985; Marconi et al. 2011, 2015; Bono et al. 2020). In Paper I, we had found PL slopes from our grid of BL Her models computed without radiative cooling (sets A and C) to be statistically similar with those for RR Lyrae models from Marconi et al. (2015) in the RIJHKS bands. In addition, we had also found the period-radius slopes of our grid of BL Her models to be similar with those for RR Lyrae models from Marconi et al. (2015) across all four sets of convection parameters, thereby suggesting a tight coupling of both pulsational and evolutionary properties between the two classes of low-mass radial pulsators. It is important to note that this similarity between RR Lyraes and BL Her stars may not hold true over the entire metallicity range, as cautioned by Marconi et al. (2015). However, RR Lyraes and T2Cs potentially following the same PL relations offers us a unique opportunity of adopting RRLs+T2Cs together for the calibration of the extragalactic distance scale (and thereby estimating the local Hubble constant) as an alternative to classical Cepheids (see e.g. Beaton et al. 2016).
First, we compared the stellar parameter space of our grid to that of the RR Lyrae models from Marconi et al. (2015), which were subsequently used in Marconi et al. (2022). We derived MLTZP relations, similar to those of Eq. (1) in Marconi et al. (2015); these relations are presented in Table 2. We highlight that while Marconi et al. (2022) uses pulsation models constrained by stellar evolution tracks, our grid of BL Her pulsation models have so far not been constrained by stellar evolutionary tracks, which may influence this comparison.
Comparison of the MLTZP relations for BL Her and RR Lyrae models.
Thus, we compared the theoretical PL and PW relations of the RR Lyrae models from Marconi et al. (2022) with those from our BL Her models in the Rubin–LSST filters. As summarized in Table 3, we find the theoretical PL slopes of the RR Lyrae models from Marconi et al. (2022) to be statistically similar to those from our low-mass BL Her models across the four different convection parameter sets in the Rubin–LSST rizy filters. This is also displayed in Fig. 3 for the BL Her models computed using convection parameter set D; similar results hold for the other convection sets. However, this result does not hold true when we consider the complete set of BL Her models with stellar masses M/ M⊙ ∈ [0.5, 0.8]. We note that this could be because the complete set of BL Her models also includes stellar masses higher than what is typically considered for BL Her stars from stellar evolutionary predictions, as discussed in Sect. 2. A similar comparison for the PWZ relations is presented in Table 4. While the PWZ slopes are still statistically different when comparing the complete set of BL Her models to the RR Lyrae models, there are a few cases where the slopes are predicted to be statistically similar when considering the low-mass BL Her models only. We note that there are several reasons why the theoretical relations for RR Lyrae models may differ from the corresponding relations for BL Her models from this work. First, the two studies use different theories of convection; for instance, Marconi et al. (2022) used the convection formulation outlined in Stellingwerf (1982a, b); whereas this work uses MESA-RSP, which follows the turbulent convection theory from Kuhfuss (1986). Next, there is further uncertainty involved with the different model atmospheres (and, thus, bolometric correction tables) used between the two studies. Lastly, note that this study uses the two-tailed t-distribution with quite a stringent confidence limit of 95% for the statistical comparison of the slopes.
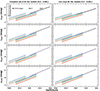 |
Fig. 3. Comparison of the theoretical PL slopes for RR Lyrae models from Marconi et al. (2022) and for BL Her models using convection parameter set D from this work in the Rubin–LSST rizy passbands. |
Comparison of the β term of the PLZ relations for RR Lyrae models with those for BL Her models.
5. Summary and conclusion
The upcoming Rubin-LSST is expected to revolutionize the field of classical pulsators with unprecedented photometric data of the deep universe. We extended the grid of BL Her models from Paper I and Paper II, computed using MESA-RSP (Smolec & Moskalik 2008; Paxton et al. 2019), to obtain new theoretical light curves in the Rubin-LSST ugrizy filters. The input stellar parameters (ZXMLTeff) were chosen typical for BL Her stars and ranges over the values: metallicity (−2.0 dex ≤ [Fe/H] ≤ 0.0 dex), stellar mass (0.5–0.8 M ⊙), stellar luminosity (50–300 L⊙), and effective temperature (full extent of the instability strip in steps of 50 K; 5900–7200 K for 50 L⊙ and 4700–6550 K for 300 L⊙). The grid of models was also computed for the four different sets of convection parameters as provided in Paxton et al. (2019). The BL Her models used in this analysis were checked for attaining full-amplitude stable pulsations and for fundamental-mode pulsation with pulsation periods between 1 and 4 days, following the conventional period classification of Soszyński et al. (2018).
In this work, we derived new theoretical PL and PW relations for the fine grid of BL Her models in the Rubin–LSST ugrizy filters and thereby studied the effects of convection parameters and metallicity on these relations. We found the PL and PW slopes for the models computed with radiative cooling (sets B and D) to be statistically similar across the Rubin-LSST grizy filters, similar to what was observed in Paper I for the Johnson-Cousin-Glass bands (BVRIJHKLL′M) and in Paper II for the Gaia passbands (GGBPGRP). Considering the low-mass models only, the convection parameter sets A, C, and D exhibit statistically similar PL slopes across most of the Rubin-LSST filters while only convection parameter sets A and D have statistically similar PW slopes. The PL relations of the BL Her models exhibit steeper slopes but smaller dispersion with increasing wavelengths in the Rubin-LSST filters.
It is important to note here that when comparing with future observations from the Rubin–LSST, in addition to comparing the PL and PW relations at mean light, we must also compare the light curve structures in the respective filters over a complete pulsation cycle to be able to distinguish among the preferred convection parameter sets better. This was recently demonstrated for the comparison of theoretical and empirical relations for BL Her stars in the Gaia passbands; although the PL and PW relations at mean light did not prefer any convection parameter set das2024, a clear preference for non-linear BL Her models computed without radiative cooling was observed when we compared model light curves to observations (for further discussion on this; see Paper III). We note that a known (but unsolved) potential shortcoming on the theoretical front is the need to adopt static model atmospheres, even though the pulsating atmosphere is clearly dynamic. This may affect detailed comparisons between observed and theoretical light curves.
The BL Her models exhibit weak or negligible effect of metallicity on the PL relations for wavelengths longer than the g filter for both the cases of the complete set of models as well as the low-mass models. However, we find a significant metallicity effect on the PL relation in the u filter, similar to what was demonstrated for wavelengths shorter than V band in Paper I. Strong metallicity effects are observed in the PWZ relations involving the u filter and are found to have significant contribution from the high-metallicity BL Her models. A possible explanation for the stronger contribution of metallicity to both the PL and PW relations from the high-metallicity BL Her models could be the increased sensitivity of bolometric corrections to metallicities for filters with wavelengths shorter than the V band (Gray 2005; Kudritzki et al. 2008). Thus, the theoretical relations do indeed predict that BL Her stars will obey almost metallicity-independent PL relations at the longer wavelengths of the Rubin-LSST (rizy).
Lastly, following recent empirical studies (Majaess 2010; Bhardwaj et al. 2017a; Braga et al. 2020) that suggest that RRab stars and T2Cs obey the same PL relations at near-infrared wavelengths, we compared the multi-filter Rubin-LSST PLZ and PWZ relations for our BL Her models with those for RR Lyrae stars by Marconi et al. (2022). We found the theoretical PL slopes of the RR Lyrae models to be statistically similar with those from our low-mass BL Her models across the four different convection parameter sets in the Rubin–LSST rizy filters. Both the PLZ and PWZ relations exhibit statistically different slopes between the RR Lyrae models and the BL Her models when the complete set is considered with stellar masses M/ M⊙ ∈ [0.5, 0.8]. We note that this could be because the complete set of BL Her models also includes stellar masses higher than what is typically considered for BL Her stars from stellar evolutionary predictions. We highlight here that the two studies use different theories of convection as well as different assumptions of model atmospheres which could contribute to different slopes for a few certain cases, when comparing the PWZ relations of the low-mass BL Her models with the RR Lyrae models.
While our fine grid of BL Her models ushers in the era of large number statistics in stellar pulsation modelling, we point out that our grid uses the four convection parameter sets, as outlined in Paxton et al. (2019); these are useful starting choices but may need further calibration to match with observed light curves in the Rubin-LSST filters over an entire pulsation cycle. In addition, a systematic and robust study of the impact of different model atmospheres adopted for the transformations of the bolometric light curves will be crucial for constraining the stellar pulsation theory further.
Data availability
Table 1 provides the light curve parameters of the BL Her models computed using MESA-RSP in the Rubin–LSST passbands and is available entirely in electronic form at https://doi.org/10.5281/zenodo.14788603.
For more details, see https://smtn-002.lsst.io/
The low mass models M/ M⊙ ∈ [0.5, 0.6] were computed with stellar luminosity L/L⊙ ∈ ⟨50,200⟩ only.
The fractional growth of the kinetic energy per pulsation period, Γ does not vary by more than 0.01, the amplitude of radius variation, ΔR by more than 0.01 R⊙, and the pulsation period, P by more than 0.01 d over the last 100 cycles of the completed integration (see Fig. 2 of Paper I for a detailed pictorial representation).
We defined a T statistic for the comparison of two linear regression slopes,  with sample sizes, n and m, respectively (Ngeow et al. 2015):
where  is the variance of the slope. The null hypothesis of equivalent slopes is rejected if T > tα/2, ν (or the probability of the observed value of the T statistic) is p < 0.05, where tα/2, ν is the critical value under the two-tailed t-distribution with 95% confidence limit (α = 0.05) and degrees of freedom, ν = n + m − 4.
Acknowledgments
The authors thank the referee for useful comments and suggestions that improved the quality of the manuscript. This research was supported by the KKP-137523 ‘SeismoLab’ Élvonal grant, the SNN-147362 grant, and the NKFIH excellence grant TKP2021-NKTA-64 of the Hungarian Research, Development and Innovation Office (NKFIH). RS is supported by the Polish National Science Centre, SONATA BIS grant, 2018/30/E/ST9/00598. This research was supported by the International Space Science Institute (ISSI) in Bern/Beijing through ISSI/ISSI-BJ International Team project ID #24-603 - “EXPANDING Universe” (EXploiting Precision AstroNomical Distance INdicators in the Gaia Universe). The authors acknowledge the use of High Performance Computing facility Pegasus at IUCAA, Pune as well as at the HUN-REN (formerly ELKH) Cloud and the following software used in this project: MESA r11701 (Paxton et al. 2011, 2013, 2015, 2018, 2019; Jermyn et al. 2023). This research has made use of NASA’s Astrophysics Data System.
References
- Asplund, M., Grevesse, N., Sauval, A. J., & Scott, P. 2009, ARA&A, 47, 481 [NASA ADS] [CrossRef] [Google Scholar]
- Baade, W. 1926, Astron. Nachr., 228, 359 [NASA ADS] [CrossRef] [Google Scholar]
- Beaton, R. L., Freedman, W. L., Madore, B. F., et al. 2016, ApJ, 832, 210 [Google Scholar]
- Beaton, R. L., Bono, G., Braga, V. F., et al. 2018, SSRv, 214, 113 [NASA ADS] [Google Scholar]
- Becker, W., & Strohmeier, W. 1940, ZA, 19, 249 [Google Scholar]
- Bhardwaj, A. 2020, J. Astrophys. Astron., 41, 23 [NASA ADS] [CrossRef] [Google Scholar]
- Bhardwaj, A., Macri, L. M., Rejkuba, M., et al. 2017a, AJ, 153, 154 [NASA ADS] [CrossRef] [Google Scholar]
- Bhardwaj, A., Rejkuba, M., Minniti, D., et al. 2017b, A&A, 605, A100 [NASA ADS] [CrossRef] [EDP Sciences] [Google Scholar]
- Bhardwaj, A., Kanbur, S. M., Rejkuba, M., et al. 2022, A&A, 668, A59 [NASA ADS] [CrossRef] [EDP Sciences] [Google Scholar]
- Bhardwaj, A., Riess, A. G., Catanzaro, G., et al. 2023, ApJ, 955, L13 [NASA ADS] [CrossRef] [Google Scholar]
- Bono, G., Caputo, F., & Santolamazza, P. 1997, A&A, 317, 171 [NASA ADS] [Google Scholar]
- Bono, G., Braga, V. F., Fiorentino, G., et al. 2020, A&A, 644, A96 [NASA ADS] [CrossRef] [EDP Sciences] [Google Scholar]
- Bono, G., Braga, V. F., & Pietrinferni, A. 2024, A&A Rev., 32, 4 [NASA ADS] [CrossRef] [Google Scholar]
- Braga, V. F., Bhardwaj, A., Contreras Ramos, R., et al. 2018, A&A, 619, A51 [NASA ADS] [CrossRef] [EDP Sciences] [Google Scholar]
- Braga, V. F., Contreras Ramos, R., Minniti, D., et al. 2019, A&A, 625, A151 [NASA ADS] [CrossRef] [EDP Sciences] [Google Scholar]
- Braga, V. F., Bono, G., Fiorentino, G., et al. 2020, A&A, 644, A95 [NASA ADS] [CrossRef] [EDP Sciences] [Google Scholar]
- Breuval, L., Riess, A. G., Kervella, P., Anderson, R. I., & Romaniello, M. 2022, ApJ, 939, 89 [NASA ADS] [CrossRef] [Google Scholar]
- Caputo, F. 1998, A&A Rev., 9, 33 [NASA ADS] [CrossRef] [Google Scholar]
- Cardelli, J. A., Clayton, G. C., & Mathis, J. S. 1989, ApJ, 345, 245 [Google Scholar]
- Catelan, M., & Smith, H. A. 2015, Pulsating Stars (Wiley-VCH) [Google Scholar]
- Catelan, M., Pritzl, B. J., & Smith, H. A. 2004, ApJS, 154, 633 [Google Scholar]
- Ciechanowska, A., Pietrzyński, G., Szewczyk, O., Gieren, W., & Soszyński, I. 2010, AcA, 60, 233 [NASA ADS] [Google Scholar]
- Das, S., Bhardwaj, A., Kanbur, S. M., Singh, H. P., & Marconi, M. 2018, MNRAS, 481, 2000 [CrossRef] [Google Scholar]
- Das, S., Kanbur, S. M., Bellinger, E. P., et al. 2020, MNRAS, 493, 29 [NASA ADS] [CrossRef] [Google Scholar]
- Das, S., Kanbur, S. M., Smolec, R., et al. 2021, MNRAS, 501, 875 [Google Scholar]
- Das, S., Molnár, L., Kanbur, S. M., et al. 2024, A&A, 684, A170 [NASA ADS] [CrossRef] [EDP Sciences] [Google Scholar]
- Das, S., Molnár, L., Kovács, G. B., et al. 2025, A&A, 694, A255 (Paper III) [NASA ADS] [CrossRef] [EDP Sciences] [Google Scholar]
- De Somma, G., Marconi, M., Molinaro, R., et al. 2022, ApJS, 262, 25 [NASA ADS] [CrossRef] [Google Scholar]
- Deb, S., & Singh, H. P. 2009, A&A, 507, 1729 [NASA ADS] [CrossRef] [EDP Sciences] [Google Scholar]
- Di Criscienzo, M., Caputo, F., Marconi, M., & Cassisi, S. 2007, A&A, 471, 893 [NASA ADS] [CrossRef] [EDP Sciences] [Google Scholar]
- Gingold, R. A. 1985, MmSAI, 56, 169 [NASA ADS] [Google Scholar]
- Gray, D. F. 2005, The Observation and Analysis of Stellar Photospheres (UK: Cambridge University Press) [Google Scholar]
- Groenewegen, M. A. T., & Jurkovic, M. I. 2017, A&A, 604, A29 [NASA ADS] [CrossRef] [EDP Sciences] [Google Scholar]
- Groenewegen, M. A. T., Udalski, A., & Bono, G. 2008, A&A, 481, 441 [NASA ADS] [CrossRef] [EDP Sciences] [Google Scholar]
- Hinshaw, G., Larson, D., Komatsu, E., et al. 2013, ApJS, 208, 19 [Google Scholar]
- Jameson, R. F. 1986, Vistas Astron., 29, 17 [NASA ADS] [CrossRef] [Google Scholar]
- Jermyn, A. S., Bauer, E. B., Schwab, J., et al. 2023, ApJS, 265, 15 [NASA ADS] [CrossRef] [Google Scholar]
- Kudritzki, R.-P., Urbaneja, M. A., Bresolin, F., et al. 2008, ApJ, 681, 269 [NASA ADS] [CrossRef] [Google Scholar]
- Kuhfuss, R. 1986, A&A, 160, 116 [NASA ADS] [Google Scholar]
- Kurucz, R. L. 1970, SAO Special Report, 309 [Google Scholar]
- Kurucz, R. L. 1993, SYNTHE Spectrum Synthesis Programs and Line Data (Cambridge, MA: Smithsonian Astrophysical Observatory) [Google Scholar]
- Madore, B. F. 1982, ApJ, 253, 575 [NASA ADS] [CrossRef] [Google Scholar]
- Madore, B. F., & Freedman, W. L. 2012, ApJ, 744, 132 [NASA ADS] [CrossRef] [Google Scholar]
- Majaess, D. J. 2010, J. Am. Assoc. Var. Star Obs., 38, 100 [Google Scholar]
- Marconi, M., & Di Criscienzo, M. 2007, A&A, 467, 223 [EDP Sciences] [Google Scholar]
- Marconi, M., Bono, G., Caputo, F., et al. 2011, ApJ, 738, 111 [NASA ADS] [CrossRef] [Google Scholar]
- Marconi, M., Coppola, G., Bono, G., et al. 2015, ApJ, 808, 50 [Google Scholar]
- Marconi, M., Molinaro, R., Dall’Ora, M., et al. 2022, ApJ, 934, 29 [NASA ADS] [CrossRef] [Google Scholar]
- Matsunaga, N., Fukushi, H., Nakada, Y., et al. 2006, MNRAS, 370, 1979 [Google Scholar]
- Matsunaga, N., Feast, M. W., & Menzies, J. W. 2009, MNRAS, 397, 933 [NASA ADS] [CrossRef] [Google Scholar]
- Matsunaga, N., Feast, M. W., & Soszyński, I. 2011, MNRAS, 413, 223 [Google Scholar]
- Molnar, T. A., Sanders, J. L., Smith, L. C., et al. 2022, MNRAS, 509, 2566 [NASA ADS] [Google Scholar]
- Neeley, J. R., Marengo, M., Bono, G., et al. 2017, ApJ, 841, 84 [Google Scholar]
- Ngeow, C.-C., Sarkar, S., Bhardwaj, A., Kanbur, S. M., & Singh, H. P. 2015, ApJ, 813, 57 [NASA ADS] [CrossRef] [Google Scholar]
- Ngeow, C.-C., Bhardwaj, A., Henderson, J.-Y., et al. 2022, AJ, 164, 154 [NASA ADS] [CrossRef] [Google Scholar]
- Paxton, B., Bildsten, L., Dotter, A., et al. 2011, ApJS, 192, 3 [Google Scholar]
- Paxton, B., Cantiello, M., Arras, P., et al. 2013, ApJS, 208, 4 [Google Scholar]
- Paxton, B., Marchant, P., Schwab, J., et al. 2015, ApJS, 220, 15 [Google Scholar]
- Paxton, B., Schwab, J., Bauer, E. B., et al. 2018, ApJS, 234, 34 [NASA ADS] [CrossRef] [Google Scholar]
- Paxton, B., Smolec, R., Schwab, J., et al. 2019, ApJS, 243, 10 [Google Scholar]
- Posten, H. O. 1984, in Robustness of the Two-Sample T-Test, eds. D. Rasch, & M. L. Tiku (Dordrecht: Springer, Netherlands), 92 [Google Scholar]
- Ripepi, V., Moretti, M. I., Marconi, M., et al. 2015, MNRAS, 446, 3034 [NASA ADS] [CrossRef] [Google Scholar]
- Ripepi, V., Catanzaro, G., Molinaro, R., et al. 2021, MNRAS, 508, 4047 [NASA ADS] [CrossRef] [Google Scholar]
- Ripepi, V., Catanzaro, G., Clementini, G., et al. 2022, A&A, 659, A167 [NASA ADS] [CrossRef] [EDP Sciences] [Google Scholar]
- Ripepi, V., Clementini, G., Molinaro, R., et al. 2023, A&A, 674, A17 [NASA ADS] [CrossRef] [EDP Sciences] [Google Scholar]
- Rodrigo, C., & Solano, E. 2020, in XIV.0 Scientific Meeting (virtual) of the Spanish Astronomical Society, 182 [Google Scholar]
- Rodrigo, C., Solano, E., & Bayo, A. 2012, SVO Filter Profile Service Version 1.0, IVOA Working Draft 15 October 2012 [CrossRef] [Google Scholar]
- Salaris, M., & Cassisi, S. 2005, Evolution of Stars and Stellar Populations (Wiley-VCH), 400 [Google Scholar]
- Sicignano, T., Ripepi, V., Marconi, M., et al. 2024, A&A, 685, A41 [NASA ADS] [CrossRef] [EDP Sciences] [Google Scholar]
- Smolec, R., & Moskalik, P. 2008, AcA, 58, 193 [NASA ADS] [Google Scholar]
- Smolec, R., & Moskalik, P. 2012, MNRAS, 426, 108 [NASA ADS] [CrossRef] [Google Scholar]
- Smolec, R., Moskalik, P., Plachy, E., Soszyński, I., & Udalski, A. 2018, MNRAS, 481, 3724 [NASA ADS] [CrossRef] [Google Scholar]
- Soszyński, I., Udalski, A., Szymański, M. K., et al. 2008, AcA, 58, 293 [Google Scholar]
- Soszyński, I., Udalski, A., Szymański, M. K., et al. 2014, AcA, 64, 177 [Google Scholar]
- Soszyński, I., Udalski, A., Szymański, M. K., et al. 2017, AcA, 67, 297 [Google Scholar]
- Soszyński, I., Udalski, A., Szymański, M. K., et al. 2018, AcA, 68, 89 [Google Scholar]
- Stellingwerf, R. F. 1982a, ApJ, 262, 330 [NASA ADS] [CrossRef] [Google Scholar]
- Stellingwerf, R. F. 1982b, ApJ, 262, 339 [NASA ADS] [CrossRef] [Google Scholar]
- Trentin, E., Ripepi, V., Molinaro, R., et al. 2024, A&A, 681, A65 [NASA ADS] [CrossRef] [EDP Sciences] [Google Scholar]
- Wallerstein, G. 2002, PASP, 114, 689 [Google Scholar]
- Wesselink, A. J. 1947, BAN, 10, 256 [NASA ADS] [Google Scholar]
- Wielgórski, P., Pietrzyński, G., Gieren, W., et al. 2024, A&A, 689, A241 [NASA ADS] [CrossRef] [EDP Sciences] [Google Scholar]
Appendix A: Chemical compositions of the BL Her models
In Table A.1, we present the equivalent ZX values for each [Fe/H] value.
Chemical compositions of the adopted pulsation models.
Appendix B: Bailey diagram
The Bailey diagram for the BL Her models computed using convection parameter set A as a function of stellar mass, chemical composition and wavelength is displayed in Fig. B.1. Similar results hold for the other convection sets.
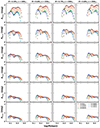 |
Fig. B.1. Bailey diagram for the BL Her models computed using convection parameter set A as a function of stellar mass, chemical composition and wavelength. |
Appendix C: Theoretical PL an PW relations
The theoretical PL and PW relations for the BL Her models in the Rubin–LSST filters across the different convection parameter sets are presented in Table C.1 and Table C.2, respectively. The theoretical PLZ relations of the BL Her models as a function of stellar mass and metallicity are provided in Tables C.3 and C.4, respectively. Corresponding PWZ relations are given in Tables C.5 and C.6, respectively.
Comparison of the slopes of the PL relations for BL Her stars of the mathematical form: Mλ = alog(P)+b.
Comparison of the slopes of the PW relations for BL Her stars of the mathematical form: Wλ = alog(P)+b.
The predicted multi-filter PL and PW relations of the BL Her models with different chemical compositions across the different Rubin-LSST wavelengths for the convective parameter sets A, B, C, and D are displayed in Fig. C.1 and Fig. C.2, respectively. A comparison of the PL slopes of the BL Her models as a function of chemical composition across different Rubin-LSST filters for the four sets of convective parameters is presented in Fig. C.3.
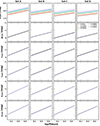 |
Fig. C.1. Predicted multi-filter PL relations of the BL Her models with different chemical compositions across the different Rubin-LSST wavelengths for the convective parameter sets A, B, C, and D. The y-scale is same (2.5 mag) in each panel for a relative comparison. |
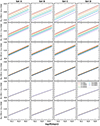 |
Fig. C.2. Predicted multi-filter period-Wesenheit (Wug, Wur, Wgr, Wgi, Wiz, Wgy) relations of the BL Her models with different chemical compositions across the different Rubin-LSST wavelengths for the convective parameter sets A, B, C, and D. The y-scale is same (3.5 mag) in each panel for a relative comparison. |
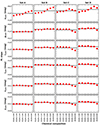 |
Fig. C.3. Comparison of the PL slopes of the BL Her models as a function of increasing metallicity (see Table A.1 for equivalent ZX values) across the different Rubin-LSST filters for the convective parameter sets A, B, C, and D. The horizontal lines represent the mean values of the slopes in the individual sub-plots. The y-scale is same (two units) in each panel for a relative comparison. |
Appendix D: Modified PLZ and PWZ relations
The modified PLZ and PWZ relations are presented in Tables D.1 and D.2, respectively.
PLZ relations for BL Her models at different wavelengths for the complete set of models and for low-mass models only.
PLZ relations for BL Her models at different wavelengths in the low- and the high-metallicity regimes.
PWZ relations for BL Her models at different wavelengths for the complete set of models and for low-mass models only.
PWZ relations for BL Her models at different wavelengths in the low- and the high-metallicity regimes.
Modified PLZ relations for BL Her models at different wavelengths using different convective parameter sets.
Modified PWZ relations for BL Her models at different wavelengths using different convective parameter sets.
All Tables
Light curve parameters of the BL Her models used in this analysis computed using MESA-RSP.
Comparison of the β term of the PLZ relations for RR Lyrae models with those for BL Her models.
Comparison of the slopes of the PL relations for BL Her stars of the mathematical form: Mλ = alog(P)+b.
Comparison of the slopes of the PW relations for BL Her stars of the mathematical form: Wλ = alog(P)+b.
PLZ relations for BL Her models at different wavelengths for the complete set of models and for low-mass models only.
PLZ relations for BL Her models at different wavelengths in the low- and the high-metallicity regimes.
PWZ relations for BL Her models at different wavelengths for the complete set of models and for low-mass models only.
PWZ relations for BL Her models at different wavelengths in the low- and the high-metallicity regimes.
Modified PLZ relations for BL Her models at different wavelengths using different convective parameter sets.
Modified PWZ relations for BL Her models at different wavelengths using different convective parameter sets.
All Figures
|
Fig. 1. Theoretical light curves of a few BL Her models in the Rubin-LSST filters computed using convection parameter set A. The input stellar parameters of the corresponding models are included in the format (Z, M/ M⊙, L/L⊙, Teff) in each sub-plot. The increasing stellar luminosity (L/L⊙) are plotted from the bottom to the top panels, while the increasing effective temperature values (Teff) are displayed from the right to the left panels. |
| In the text | |
|
Fig. 2. Contribution of the γ term (metallicity effect) obtained from the theoretical PLZ relations for BL Her models computed using the convection parameter set A. Figure updated from Paper II to also include the Rubin–LSST filters (ugrizy) in addition to the bolometric (Bol), Johnson-Cousins-Glass (UBVRIJHKLL′M) and Gaia (GGBPGRP) passbands. The different panels present results from the complete set of models compared with the high-metallicity models (Z = 0.00424, 0.00834, 0.01300) and the low-metallicity models (Z = 0.00014, 0.00043, 0.00061, 0.00135). The x-axis is in increasing order of the central effective wavelengths (λeff) of the respective passbands as provided by the SVO Filter Profile Service (Rodrigo et al. 2012; Rodrigo & Solano 2020). |
| In the text | |
|
Fig. 3. Comparison of the theoretical PL slopes for RR Lyrae models from Marconi et al. (2022) and for BL Her models using convection parameter set D from this work in the Rubin–LSST rizy passbands. |
| In the text | |
|
Fig. B.1. Bailey diagram for the BL Her models computed using convection parameter set A as a function of stellar mass, chemical composition and wavelength. |
| In the text | |
|
Fig. C.1. Predicted multi-filter PL relations of the BL Her models with different chemical compositions across the different Rubin-LSST wavelengths for the convective parameter sets A, B, C, and D. The y-scale is same (2.5 mag) in each panel for a relative comparison. |
| In the text | |
|
Fig. C.2. Predicted multi-filter period-Wesenheit (Wug, Wur, Wgr, Wgi, Wiz, Wgy) relations of the BL Her models with different chemical compositions across the different Rubin-LSST wavelengths for the convective parameter sets A, B, C, and D. The y-scale is same (3.5 mag) in each panel for a relative comparison. |
| In the text | |
|
Fig. C.3. Comparison of the PL slopes of the BL Her models as a function of increasing metallicity (see Table A.1 for equivalent ZX values) across the different Rubin-LSST filters for the convective parameter sets A, B, C, and D. The horizontal lines represent the mean values of the slopes in the individual sub-plots. The y-scale is same (two units) in each panel for a relative comparison. |
| In the text | |
Current usage metrics show cumulative count of Article Views (full-text article views including HTML views, PDF and ePub downloads, according to the available data) and Abstracts Views on Vision4Press platform.
Data correspond to usage on the plateform after 2015. The current usage metrics is available 48-96 hours after online publication and is updated daily on week days.
Initial download of the metrics may take a while.