| Issue |
A&A
Volume 684, April 2024
|
|
|---|---|---|
| Article Number | A170 | |
| Number of page(s) | 19 | |
| Section | Stellar structure and evolution | |
| DOI | https://doi.org/10.1051/0004-6361/202348280 | |
| Published online | 19 April 2024 | |
A theoretical framework for BL Her stars
II. New period-luminosity relations in Gaia passbands⋆
1
Konkoly Observatory, HUN-REN Research Centre for Astronomy and Earth Sciences, Konkoly-Thege Miklós út 15-17, 1121 Budapest, Hungary
2
CSFK, MTA Centre of Excellence, Budapest, Konkoly Thege Miklós út 15-17. 1121, Hungary
e-mail: susmita.das@csfk.org
3
ELTE Eötvös Loránd University, Institute of Physics and Astronomy, 1117 Pázmány Péter sétány 1/A, Budapest, Hungary
4
Department of Physics, State University of New York Oswego, Oswego, NY 13126, USA
5
INAF – Osservatorio Astronomico di Capodimonte, Salita Moiariello 16, 80131 Naples, Italy
6
Department of Physics & Astrophysics, University of Delhi, Delhi 110007, India
7
Nicolaus Copernicus Astronomical Center, Polish Academy of Sciences, Bartycka 18, 00-716 Warsaw, Poland
Received:
15
October
2023
Accepted:
21
January
2024
Context. In the era of the Hubble tension, it is crucial to obtain a precise calibration of the period-luminosity (PL) relations of classical pulsators. Type II Cepheids (T2Cs; often exhibiting negligible or weak metallicity dependence on PL relations) used in combination with RR Lyraes and the tip of the red giant branch may prove useful as an alternative to classical Cepheids for the determination of extragalactic distances.
Aims. We present new theoretical PL and period-Wesenheit (PW) relations for a fine grid of convective BL Her (the shortest period T2Cs) models computed using MESA-RSP in the Gaia passbands and we compare our results with the empirical relations from Gaia DR3. Our goal is to study the effect of metallicity and convection parameters on the theoretical PL and PW relations.
Methods. We used the state-of-the-art 1D non-linear radial stellar pulsation tool MESA-RSP to compute models of BL Her stars over a wide range of input parameters: metallicity (−2.0 dex ≤ [Fe/H] ≤ 0.0 dex), stellar mass (0.5 M⊙ − 0.8 M⊙), stellar luminosity (50 L⊙ − 300 L⊙), and effective temperature (across the full extent of the instability strip; in steps of 50 K). We used the Fourier decomposition technique to analyse the light curves obtained from MESA-RSP and Gaia DR3 and then compared the theoretical and empirical PL and PW relations in the Gaia passbands.
Results. The BL Her stars in the All Sky region exhibit statistically different PL slopes compared to the theoretical PL slopes computed using the four sets of convection parameters. We find the empirical PL and PW slopes from BL Her stars in the Magellanic Clouds to be statistically consistent with theoretical relations computed using the different convection parameter sets in the Gaia passbands. There is a negligible effect coming from the metallicity on the PL relations in the individual Gaia passbands. However, there is a small but significant negative coefficient of metallicity in the PWZ relations for the BL Her models using the four sets of convection parameters. This could be attributed to the increased sensitivity of bolometric corrections to metallicities at wavelengths shorter than the V band. Our BL Her models also suggest a dependence of the mass-luminosity relation on metallicity. We found the observed Fourier parameter space to be covered well by our models. Higher mass models (> 0.6 M⊙) may be needed to reliably model the observed light curves of BL Her stars in the All-Sky region. We also found the theoretical light curve structures (especially the Fourier amplitude parameters) to be affected by the choice of convection parameters.
Key words: hydrodynamics / methods: numerical / stars: low-mass / stars: oscillations / stars: Population II / stars: variables: Cepheids
Full Tables 2 and 4 are available at the CDS via anonymous ftp to cdsarc.cds.unistra.fr (130.79.128.5) or via https://cdsarc.cds.unistra.fr/viz-bin/cat/J/A+A/684/A170
© The Authors 2024
 Open Access article, published by EDP Sciences, under the terms of the Creative Commons Attribution License (https://creativecommons.org/licenses/by/4.0), which permits unrestricted use, distribution, and reproduction in any medium, provided the original work is properly cited.
This article is published in open access under the Subscribe to Open model. Subscribe to A&A to support open access publication.
1. Introduction
Type II Cepheids (T2Cs) are low-mass (typically < 1 M⊙) classical pulsators that are 1 − 4 mag brighter than RR Lyraes and 1.5 − 2 mag fainter than classical Cepheids of similar periods. This makes them useful astrophysical objects, especially with respect to old, metal-poor stellar systems with scarce classical Cepheids and RR Lyrae (see reviews, Caputo 1998; Wallerstein 2002; Sandage & Tammann 2006). T2Cs are known to pulsate in the fundamental mode (Bono et al. 1997b). However, Soszyński et al. (2019) recently discovered two first-overtone T2Cs in the Large Magellanic Cloud (LMC). Based on their pulsation periods, T2Cs are further classified as: the BL Herculis stars (BL Her: 1 ≲ P(days) ≲ 4), the W Virginis stars (W Vir: 4 ≲ P(days) ≲ 20), and the RV Tauri stars (RV Tau: P ≳ 20 days; Soszyński et al. 2018). We note that the period separation for the different sub-classes is not strict and may vary in different stellar environments. In addition, there is a fourth sub-class of brighter and bluer stars than W Vir: the peculiar W Vir (pW Vir) stars (Soszyński et al. 2008). Stars belonging to the different sub-classes exhibit different light curve morphologies and are expected to be at different evolutionary stages (Gingold 1985; Wallerstein 2002; Bhardwaj 2020; Bono et al. 2020).
Bono et al. (2020) noted that the evolutionary status of T2Cs is rather complex as compared to that of RR Lyraes and classical Cepheids. The authors predicted BL Her stars to be double-shell burning on the first crossing of the instability strip of the Hertzsprung-Russell diagram and W Vir stars to be hydrogen-shell burning on the second crossing of the instability strip. This implies a common evolutionary channel for both the sub-types and the authors therefore suggest that BL Her and W Vir stars be considered a single group of classical pulsators. Bono et al. (2020) also suggested a marginal dependence of the pulsation properties of T2Cs on metallicity.
T2Cs obey well defined period-luminosity (PL) relations similar to RR Lyraes (in the near-infrared bands) and classical Cepheids, which make them useful distance indicators (see e.g. Ripepi et al. 2015; Bhardwaj et al. 2017b; Groenewegen & Jurkovic 2017; Braga et al. 2018; Beaton et al. 2018). However, their more popular counterparts, namely, classical Cepheids, are more frequently studied and are known to exhibit strong metallicity effect on the PL relations, especially at shorter wavelengths (see, for example, Ripepi et al. 2021, 2022; Breuval et al. 2022; De Somma et al. 2022; Bhardwaj et al. 2023). In contrast, T2Cs seem to exhibit weak or negligible metallicity effect on the PL relations, as suggested by empirical (Matsunaga et al. 2006, 2009, 2011; Groenewegen & Jurkovic 2017; Ngeow et al. 2022) and theoretical (Di Criscienzo et al. 2007; Das et al. 2021) studies. T2Cs could therefore potentially exhibit a truly universal PL relation throughout different stellar environments (and, thus, metallicities) and could serve as an alternative to classical Cepheids in the calibration of the extragalactic distance scale (Majaess 2010; Braga et al. 2020; Das et al. 2021). However, Wielgórski et al. (2022) recently reported a significant metallicity effect on the near-infrared PL relations of field T2Cs, although with the caveat that the sample size is rather small.
On the empirical front, stellar variability studies are undergoing a renaissance with ground-based wide-field time-domain surveys and space-based missions. In particular, the Gaia mission (Gaia Collaboration 2016b) promises to provide a percent-level calibration of the distance scale with parallaxes for a large sample of pulsating stars. With every subsequent data release (DR1, DR2, EDR3, and DR3, Gaia Collaboration 2016a, 2018, 2021, 2023), the Gaia mission provides multi-epoch observations and averaged astrophysical parameters for an increasing number of stars, with data for nearly 12 million variable sources in DR3 (for a detailed summary of the properties of the different variable sources, see Eyer et al. 2023). Ripepi et al. (2023) presented the Gaia DR3 catalogue of 15 006 Cepheids, including all subtypes, of which there are multi-band time-series photometry for 660 BL Her stars.
There are several linear and non-linear convective BL Her models in the literature (Buchler & Moskalik 1992; Bono et al. 1995, 1997b,a; Marconi & Di Criscienzo 2007; Smolec et al. 2012; Smolec & Moskalik 2012, 2014; Smolec 2016) but only a few that provide theoretical PL and PR relations for a large grid of BL Her models (Di Criscienzo et al. 2007; Marconi & Di Criscienzo 2007; Das et al. 2021). In a recent paper, Das et al. (2021; hereafter Paper I) computed a very fine grid of convective BL Her models using the state-of-the-art 1D non-linear Radial Stellar Pulsation (RSP) tool within the Modules for Experiments in Stellar Astrophysics (MESA, Paxton et al. 2011, 2013, 2015, 2018, 2019) software suite, encompassing a wide range of input parameters: metallicity (−2.0 dex ≤ [Fe/H] ≤ 0.0 dex), stellar mass (0.5–0.8 M⊙), stellar luminosity (50–300 L⊙), and effective temperature (full extent of the instability strip; in steps of 50K). MESA-RSP is an open-source code that offers the possibility of generating light curves of classical pulsators at multiple wavelengths, while also varying the convective parameters. Although the longer-period T2Cs pose challenges for the existing pulsation codes due to their highly non-adiabatic nature, BL Her stars may be modelled reliably using MESA-RSP. The higher mass models were inspired by the grid of 0.6 M⊙ and 0.8 M⊙ non-linear convective T2C models in Smolec (2016). Furthermore, Paper I obtained theoretical PL and PR relations for BL Her models at the Johnson-Cousins-Glass bands UBVRIJHKLL′M and tested the effects of metallicity and convection parameters on these relations.
A comparison of the theoretical mean light relations and light curves of classical pulsators with those from observations not only provides stringent constraints for the stellar pulsation models, but also serves as probes for understanding the theory of stellar evolution and pulsation (Simon 1985; Marconi et al. 2013b, 2017; Bhardwaj et al. 2017a; Das et al. 2018, 2020). Of noteworthy importance is the case of period doubling in BL Her stars, which was predicted by Buchler & Moskalik (1992) and was later observed (and consistently modelled) in a 2.4-d BL Her type variable in the Galactic bulge (Soszyński et al. 2011; Smolec et al. 2012). Paper I compared theoretical PL relations for BL Her models computed using MESA-RSP with empirical PL relations in the LMC (Matsunaga et al. 2009; Bhardwaj et al. 2017b; Groenewegen & Jurkovic 2017), SMC (Matsunaga et al. 2011; Groenewegen & Jurkovic 2017), Galactic bulge (Bhardwaj et al. 2017c), and Galactic globular clusters (Matsunaga et al. 2006), along with prior theoretical PL relations derived by Di Criscienzo et al. (2007). More recently, Jurkovic et al. (2023) presented results from T2Cs in the Kepler K2 mission and corresponding BaSTI (Bag of Stellar Tracks and Isochrones) evolutionary models (Hidalgo et al. 2018) with metallicities, [Fe/H] = −2.50, −1.20 and 0.06, and masses from 0.45 M⊙ to 0.8 M⊙.
As an extension to Paper I, the aim of this project is to (i) compute Gaia passband light curves for a very fine grid of BL Her models encompassing a wide range of metallicities, stellar mass, stellar luminosity and effective temperature using four different sets of convection parameters with MESA-RSP, (ii) obtain new theoretical PL and PW relations in the Gaia passbands, (iii) study the effect of metallicity and convection parameters on these relations, and (iv) identify whether there exists any particular convection set that is preferred by the empirical results. The structure of the paper is as follows: the theoretical and empirical data used in this analysis are described in Sect. 2. We present new theoretical PL and PW relations of the BL Her models in the Gaia passbands in Sect. 3 and investigate the effect of metallicity and convection parameters. We probe the dependence of the mass-luminosity relation of the BL Her models on the chemical composition in Sect. 4. We compare the theoretical and observed Fourier parameters of the BL Her light curves in Sect. 5. Finally, we summarize the results of our study in Sect. 6.
2. Data and methodology
2.1. Stellar pulsation models
A detailed description of the BL Her models computed using MESA-RSP and used for this analysis is presented in Paper I. In brief, we computed a fine grid of BL Her models using four different sets of convection parameters (see Table 4 of Paxton et al. 2019), each with increasing complexity: set A (the simplest convection model), set B (radiative cooling added), set C (turbulent pressure and turbulent flux added), and set D (all of these effects added simultaneously). The grid of stellar pulsation models computed using MESA-RSP (i) uses the Kuhfuss (1986) theory of turbulent convection (ii) follows the treatment of stellar pulsation as outlined in Smolec & Moskalik (2008), and (iii) takes into account the structure of the non-rotating and chemically homogeneous stellar envelope only, without considering the detailed core structure. The BL Her models were computed using MESA version r117011.
2.2. Linear and non-linear computations
We begin with the linear computations for a fine grid of BL Her models with the following input parameters for each of the four convection parameter sets:
-
Metallicity (see Table 1 for corresponding ZX values) [Fe/H] = −2, −1.5, −1.35, −1, −0.5, −0.2, 0
-
Stellar mass (M)
-
Low-mass range = 0.5 M⊙, 0.55 M⊙, 0.6 M⊙
-
High-mass range = 0.65 M⊙, 0.7 M⊙, 0.75 M⊙, 0.8 M⊙
-
-
Table 1.
Chemical compositions of the adopted pulsation models.
Stellar luminosity (L)
-
For low-mass range = 50 − 200 L⊙, in steps of 50 L⊙
-
For high-mass range = 50 − 300 L⊙, in steps of 50 L⊙
-
-
Effective temperature (Teff) = 4000 − 8000 K, in steps of 50 K.
Each ZXMLTeff combination serves as the input stellar parameters for the linear computations; equilibrium static models are constructed, and their linear stability analysis conducted, resulting in linear periods of the radial pulsation modes and their respective growth rates (Paxton et al. 2019). Positive growth rates in the fundamental mode help in estimating the boundaries of the IS (see Fig. 1 of Paper I). The equilibrium static models from the linear computations serve as input for the non-linear model integration. The non-linear model integrations are carried for 4000 pulsation cycles each and only models with non-linear periods between 1 − 4 days are considered as BL Her models, following the conventional classification for BL Her stars (Soszyński et al. 2018). Finally, we check for single periodicity and full-amplitude stable pulsation of the models using the condition that the fractional growth of the kinetic energy per pulsation period Γ does not vary by more than 0.01, the amplitude of radius variation ΔR by more than 0.01 R⊙, and the pulsation period P by more than 0.01 d over the last 100 cycles of the completed integration. The total number of BL Her models in each convection parameter set finally accepted for this analysis is summarised in Table A.1.
BL Her stars are traditionally considered to be low mass (M ≤ 0.6 M⊙) stars, which evolve towards the Asymptotic Giant Branch (AGB) from the blue edge of the Zero Age Horizontal Branch (ZAHB), crossing the instability strip at luminosities higher than RR Lyrae stars (Gingold 1985; Bono et al. 1997b; Caputo 1998). However, a photometric study of the prototype, BL Herculis itself, by Alexander et al. (1987) estimated its stellar mass to be M ≈ 0.75 M⊙. A few theoretical studies for BL Her stars also include masses higher than 0.6 M⊙ (Marconi & Di Criscienzo 2007; Smolec et al. 2012). Furthermore, a wider mass range can accommodate the differences between evolutionary codes, as these have uncertainties of their own depending on the assumptions they include, e.g., on convection efficiency. In light of this, we use the stellar masses of BL Her models from evolutionary tracks not as stringent constraints but as useful hints towards our choice of input parameters in the pulsation code and explore the possibility of higher mass models. However, for a reliable comparison with observations, we carry out the theoretical analysis twice: first, with the entire set of BL Her models (low mass+high mass; 0.5 − 0.8 M⊙) and next, with the subset of low mass BL Her models (0.5 − 0.6 M⊙) only. We note here that the higher stellar mass (M > 0.6 M⊙) and lower metallicity (Z = 0.00014) models may have an overlap with evolved RR Lyraes. A detailed theoretical investigation is crucial to shed light on the longstanding RR Lyrae–T2C separation problem based on their evolutionary status (see also, Braga et al. 2020).
2.3. Processing the model data
One of the outputs of the MESA-RSP non-linear model computations is bolometric light curves, which can thereby be transformed into light curves in the required passbands, as described in Paxton et al. (2018) and Paper I. The transformation of the absolute bolometric magnitudes into the absolute magnitudes in the Johnson-Cousins-Glass bands UBVRIJHKLL′M in Paper I was done using pre-computed bolometric correction tables from Lejeune et al. (1998) included in MESA. However, pre-computed bolometric correction tables to transform bolometric light curves into Gaia passbands are not yet included in MESA. We therefore opted to include user-provided bolometric correction tables defined as a function of the stellar photosphere in terms of Teff (K), log(g(cm s−2)), and metallicity [M/H]. The bolometric correction tables used to transform the theoretical bolometric light curves into the Gaia passbands (G, GBP, and GRP) in this study are obtained from the MIST2 (MESA Isochrones & Stellar Tracks) packaged model grids; the bolometric correction tables were computed using 1D atmosphere models (based on ATLAS12/SYNTHE; Kurucz 1970, 1993). An example of the light curves in the bolometric and the Gaia passbands (G, GBP, and GRP) for a BL Her model computed using the four sets of convection parameters is presented in Fig. 1.
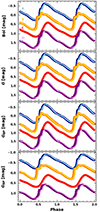 |
Fig. 1. Light curves in the bolometric, G, GBP, and GRP bands (shown from top to bottom) for a BL Her model with input parameters, Z = 0.00043, X = 0.75041, M = 0.6 M⊙, L = 100 L⊙, and T = 6700 K computed using four sets of convection parameters (sets A, B, C, and D depicted in different colours). Light curves are vertically offset by 0.5 mag successively for visualisation purposes. The light curves in the foreground are computed using MESA r11701 and used in this analysis while the corresponding light curves depicted in the background are computed using the latest version, MESA r23.05.1. |
As mentioned earlier, the BL Her models used in this work were computed using MESA r11701; however, the latest version of the software is now MESA r23.05.1. To test the compatibility of our models with the latest MESA version, we computed a particular BL Her model with the input parameters, Z = 0.00043, X = 0.75041, M = 0.6 M⊙, L = 100 L⊙, and T = 6700 K using MESA r23.05.1. The comparison of the light curves of the BL Her model in the Gaia passbands and over the four sets of convection parameters computed using both MESA versions is displayed in Fig. 1. We find the outputs from both MESA versions to be quite similar; this is because while there have been changes incorporated in the MESA software itself, resulting in the release of different versions3, no significant changes have been made to the MESA-RSP module of the software. We note that while MESA is a 1D stellar evolution code, we have made use of the MESA-RSP code for this work, which is responsible for the computations of non-linear radial stellar pulsations.
As in Paper I, the theoretical light curves in the Gaia passbands are fitted with the Fourier sine series (see, for example, Deb & Singh 2009; Das et al. 2018) of the form:
where x is the pulsation phase, m0 is the mean magnitude, and N is the order of the fit (N = 20). In this work, in addition to deriving new theoretical PL and PW relations using m0, as was done in Paper I, we also study the light curve structures using the Fourier decomposition technique. The Fourier amplitude and phase coefficients (Ak and ϕk) have been re-defined as Fourier parameters in terms of amplitude ratios and phase differences as follows:
where k > 1 and 0 ≤ ϕk1 ≤ 2π. The errors in the Fourier parameters are thereby calculated using error propagation in the Fourier coefficients (see Deb & Singh 2010). Table 2 summarises the input stellar parameters of the BL Her models used in this analysis, along with the computed light curve parameters in the different Gaia passbands obtained from the Fourier fitting.
Light curve parameters of the BL Her models used in this analysis computed using MESA-RSP (extract).
We also defined the peak-to-peak amplitude A of the light curve as the difference in the minimum and the maximum of the light variations:

where (Mλ)min and (Mλ)max are the minimum and maximum magnitudes obtained from the Fourier fits in the λ band, respectively.
2.4. Observations from Gaia DR3
The third data release of the European Space Agency’s (ESA) Gaia mission (Gaia DR3; Gaia Collaboration 2016b, 2023) is based on data collected over a period of 34 months and provides an unprecedented wealth of epoch photometry in the G, GBP, and GRP passbands, among other astrophysical parameters. One important difference of Gaia DR3 from Gaia DR2 is the existence of five sub-regions in Gaia DR3: the Large and Small Magellanic Clouds (LMC and SMC), the Andromeda (M31) and Triangulum (M33) galaxies, and all of the remaining sky excluding the four sub-regions (referred to as All Sky), as opposed to three sub-regions in Gaia DR2. For more details on how these sub-regions are defined, the interested reader is referred to Table 1 of Ripepi et al. (2023).
The Gaia DR3 catalogue contains a sample of 15,006 Cepheids of all types across the five sub-regions. However, the completeness of the sample varies significantly with the region of the sky and also with the Cepheid type (Ripepi et al. 2023). In particular, owing to their faint magnitudes, no BL Her star has been detected in the distant M31 and M33 galaxies. This study therefore includes observed BL Her stars in the LMC, SMC and All Sky sub-regions of Gaia DR3 only. At first glance, the Gaia DR3 catalogue contains 545 BL Her stars. However, care should be taken to take objects incorrectly classified by the Specific Objects Study (SOS) Cep&RRL pipeline in Gaia DR3 into account. A straightforward cross-match between the Gaia DR3 catalogue and Table 6 of Ripepi et al. (2023) adds 221 more BL Her stars while removing 106 misclassified BL Her stars, resulting in a total of 660 BL Her stars in the LMC, SMC and All Sky regions from Gaia DR34. Table 3 presents the number of BL Her stars with photometric data in the three Gaia passbands.
Number of observed BL Her stars with epoch photometry data in the Gaia passbands from the Gaia DR3 catalogue in the All Sky, LMC, and SMC sub-regions.
In an effort to make use of the best-quality observed light curves available for BL Her stars from the Gaia DR3 catalogue, we restricted our sample to include only those stars with more than 20 epoch observations for further analysis. As with the theoretical BL Her light curves, the observed light curves of the BL Her stars in the Gaia passbands from Gaia DR3 are also fitted with the Fourier sine series of the mathematical form as given in Eq. (1). We first fit the observed light curves with an initial order of fit N = 4 and remove the points lying 2σ away from the fit. We then use the Baart’s condition (Baart 1982) to obtain the optimum order of fit by varying N from 4 to 8, as described below (see, for more details, Petersen 1986).
Care should be taken to use the optimum number of terms in the Fourier decomposition of the observed light curves. This is because an N too small results in systematic deviations from the best estimate while an N too large will also fit the noise. The optimum order of fit is the one for which the residuals of the fit consist of noise only, without any trends from the residuals. To determine this, we used the unit-lag auto-correlation of the sequence of residuals (Baart 1982; Petersen 1986) defined as:
where vj is the jth residual,  denotes the average of the residuals and j = 1, …n represents the number of data points in the observed light curve. The residual of the fitted light curve v is obtained as follows:
![$$ \begin{aligned} { v} = m(x) - [m_0 + \sum _{k=1}^{N}A_k \sin (2 \pi kx+\phi _k)]. \end{aligned} $$](/articles/aa/full_html/2024/04/aa48280-23/aa48280-23-eq12.gif)
For the calculation of ρ, we chose the ordering of vj not from the original time-sequence but from the order of increasing phase values. Residuals with a definite trend will result in ρ ≈ 1. Uncorrelated residuals will exhibit smaller values of ρ, with the idealized case of residuals with equal magnitudes and alternating signs resulting in ρ ≈ −1. According to Baart (1982), a value of ρ ≥ [n − 1]−1/2 (n is the number of observations) indicates the presence of a trend, while ρ ≤ 2[n − 1]−1/2 suggests a lack of any trend in the residuals. The auto-correlation cut-off tolerance is therefore defined as:
![$$ \begin{aligned} \rho _c:= \rho (\mathrm{cut}) = [2(n-1)]^{-1/2}. \end{aligned} $$](/articles/aa/full_html/2024/04/aa48280-23/aa48280-23-eq13.gif)
The optimum order of fit N is thereby obtained as follows: a series of Fourier decompositions is calculated using Eq. (1) with increasing N from 4 to 8. For every decomposition, ρ = ρ(N) was calculated using Eq. (4). The value of N for which |ρ − ρc| is minimised is the one for which residuals consist of noise only and is chosen as the optimum order of fit.
Finally, we fit the observed light curves with outliers ≥2σ removed using the optimum order of fit. The Fourier parameters and associated errors are thereby calculated using Eq. (2). The number of observed BL Her stars in the respective Gaia passbands that were ultimately used in this analysis is summarised in the last column of Table 3 and the light curve parameters of the observed BL Her stars are listed in Table 4.
Light curve parameters of observed BL Her stars (extract).
3. Period-luminosity relations
The mean magnitudes obtained from the Fourier-fitted observed and theoretical light curves of the BL Her stars are used to obtain period-luminosity (PL) relations in the Gaia passbands (G, GBP, GRP) of the mathematical form:
where Mλ and mλ refer to the absolute and the apparent magnitudes in a given band, λ, respectively. We note here that the apparent magnitudes of the observed BL Her stars from Gaia DR3 have not been corrected for extinction in the present study. This follows from Ripepi et al. (2019), where the authors noted that extinction only affects the PL zero points, while keeping the PL slopes unaffected in LMC and SMC, given their small average foreground reddening values of the order of E(B − V)≈ 0.08 and 0.04 mag, respectively.
However, to account for uncertainties related to PL relations obtained using apparent magnitudes without extinction correction, we also use Wesenheit indices (Madore 1982), which act as pseudo-magnitudes and thereby derive theoretical and empirical period-Wesenheit (PW) relations. We use the new Wesenheit magnitudes as defined by Ripepi et al. (2019) for Gaia DR3:

where G, GBP, and GRP are the apparent and the absolute magnitudes in the respective Gaia passbands for the empirical and theoretical PW relations, respectively, of the mathematical form:
The variation of the theoretical PL and PW relations obtained from the BL Her models as a function of the different convection parameter sets and metallicity across the different Gaia wavelengths is presented in Fig. 2, as well as in Fig. B.1, and discussed further in the subsequent sections. A comparison of the theoretical PL and PW relations for BL Her models obtained using linear and non-linear pulsation periods is also presented in Table C.1.
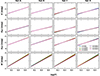 |
Fig. 2. PL and PW relations of the BL Her models with different chemical compositions across different wavelengths for the convective parameter sets A, B, C, and D. |
3.1. Effects of convection parameters
To test for the effects of convection parameters on the theoretical PL and PW relations, we checked whether the slopes of the theoretical relations of the BL Her models are statistically similar when computed with the different convection parameter sets. We used the standard t-test for this, a detailed description of which is provided in Ngeow et al. (2015) and briefly summarized below. The assumptions of independent samples with normal distributions and homogeneity of variance hold true for our data sets, and for PL relations in general as shown by Bhardwaj et al. (2016) using quartile-quartile plots and bootstrapping of PL residuals. We also note the advantage of using the t-test because of their relative robustness to deviations from assumptions (see e.g. Posten 1984).
We defined a T statistic for the comparison of two linear regression slopes,  with sample sizes, n and m, respectively, as follows:
where  is the variance of the slope. The null hypothesis of equivalent slopes is rejected if T > tα/2, ν (or the probability of the observed value of the T statistic) is p < 0.05, where tα/2, ν is the critical value under the two-tailed t-distribution with 95% confidence limit (α = 0.05) and degrees of freedom, ν = n + m − 4.
The statistical comparison of the theoretical PL and PW slopes from the BL Her models with respect to the empirical slopes from Gaia DR3 across the individual Gaia passbands is listed in Table 5. Considering the complete set of BL Her models, we find that the models with radiative cooling (sets B and D) exhibit statistically similar PL and PW slopes across all the Gaia passbands. This result is similar to what was obtained for the Johnson-Cousin-Glass bands (BVRIJHKLL′M) in Paper I. However, this result does not hold true for the subset of low-mass (0.5 − 0.6 M⊙) BL Her models. The PL slopes for the low-mass BL Her models are statistically consistent across all the Gaia passbands for the convection parameter sets A, C, and D, but not with the PL slope computed using parameter set B. In addition, we find that only parameter sets A and D exhibit statistically similar PW slopes for the low-mass BL Her models.
Comparison of the slopes of the PL and PW relations for BL Her stars of the mathematical form Mλ = alog(P)+b.
A comparison of the theoretical PL and PW slopes of the BL Her models with the empirical slopes across the different Gaia wavelengths is displayed in Fig. 3. We have also considered a subset of observed BL Her stars with positive parallaxes in the All Sky region for a comparison of the theoretical slopes with the empirical slopes. From Table 5 and Fig. 3, we find that the BL Her stars in the All Sky region exhibit statistically different PL slopes compared to the theoretical PL slopes computed using the four sets of convection parameters. This is also true for the theoretical slopes obtained using the subset of low-mass models only, with the exception of the stars with positive parallaxes exhibiting statistically similar PL slopes with theoretical slopes computed using the convection parameter set B. The statistically different empirical PL slopes of the BL Her stars in the All Sky region is expected because the empirical PL slopes in the Gaia passbands are obtained using apparent magnitudes not corrected for extinction. However, the empirical PW relations from the BL Her stars in the All Sky region mostly exhibit statistically similar slopes with the theoretical PW slopes computed using the four sets of convection parameters, with a few exceptions.
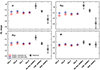 |
Fig. 3. Comparison of the theoretical PL and PW slopes of the BL Her models computed using the complete range of metallicities (−2.0 dex ≤ [Fe/H] ≤ 0.0 dex), with the empirical slopes spread across the different Gaia wavelengths. The y-scale is same (5 units) in each panel for a relative comparison. Note: the empirical PL slopes in the Gaia passbands are obtained using apparent magnitudes not corrected for extinction. |
The empirical PL and PW slopes from BL Her stars in the LMC and the SMC mostly agree well with the theoretical relations computed using the different convection parameter sets across all the Gaia passbands. BL Her stars in the Magellanic Clouds exhibiting statistically similar PL slopes with those from the models in the Gaia passbands (despite not being corrected for extinction) can be explained by the presence of small average foreground reddening values in the LMC and the SMC which affects the PL zero points but keeps the PL slopes unaffected (Ripepi et al. 2019). The fact that the empirical PL and PW slopes from the BL Her stars are statistically consistent with the theoretical slopes across the four different sets of convection parameters, while the theoretical slopes from the different convection sets themselves exhibit statistical differences amongst each other, indicates that the uncertainties from observations dominate over the uncertainty on the theoretical fits. This is especially true for the case of BL Her stars in the SMC where the empirical relations exhibit large uncertainties. However, we note here that the large dispersion in the PL and PW relations from the BL Her stars in the SMC arises because of the large depth along its line of sight (see Ripepi et al. 2022, and references therein). Larger data sets of BL Her stars with more precise observations would prove useful in the future for constraining the stellar pulsation codes better with respect to the choice of convection parameters and in the subsequent estimation of the best-fit model parameters.
The Gaia passbands are, in increasing order of the central effective wavelengths (λeff) of the respective passbands, as follows: GBP < G < GRP (Rodrigo et al. 2012; Rodrigo & Solano 2020). From Table 5, we find that the BL Her models exhibit steeper theoretical PL slopes in the Gaia passbands with increasing wavelengths. This result is consistent with the theoretical relations for the Johnson-Cousin-Glass bands (UBVRIJHKLL′M) in Paper I and also in support of similar empirical relations obtained for RR Lyraes as shown in Beaton et al. (2018), Neeley et al. (2017), Bhardwaj (2020). In addition, we also observe a decrease in the dispersion in the theoretical PL relations for BL Her models with increasing wavelength, with the smallest dispersion for the theoretical PW relations. As noted in Catelan et al. (2004), Madore & Freedman (2012), Marconi et al. (2015), the smaller dispersion in the PL relations as a function of increasing wavelength is caused by the decrease of the width in the instability strip itself at longer wavelengths.
3.2. Effect of metallicity
To test for the effect of metallicity on the PL and PW relations, we derive PLZ and PWZ relations for the BL Her models of the mathematical form:
![$$ \begin{aligned} \begin{aligned}&M_\lambda = \alpha +\beta \log (P)+\gamma \mathrm{[Fe/H]}\quad (\text{ for} \; \lambda =G,G_{BP},G_{RP}); \\&W = \alpha +\beta \log (P)+\gamma \mathrm{[Fe/H]}.\\ \end{aligned} \end{aligned} $$](/articles/aa/full_html/2024/04/aa48280-23/aa48280-23-eq20.gif)
These results are summarised in Table 6. In both the cases for the complete set of models and for the low-mass models only, we find the metallicity contribution to the PLZ relations to be negligible within 3σ uncertainties, except for a few cases using GRP. However, we always find a small but significant negative coefficient of metallicity in the PWZ relations for the BL Her models using the four sets of convection parameters and for both the cases of the complete set of models and the low-mass models.
PLZ relations for BL Her models of the mathematical form Mλ = α + βlog(P)+γ[Fe/H] for different wavelengths using different convective parameter sets.
The relatively larger metallicity dependence in the PWZ relations from the BL Her models using the Gaia passbands is very interesting. This is because a similar result is also exhibited by the PWGaiaZ relations from the classical Cepheids (see Ripepi et al. 2022; Breuval et al. 2022; Trentin et al. 2024).
We investigate why a small but significant metallicity contribution in the Wesenheit relations occurs when there is no significant effect of metallicity in the individual Gaia passbands. To this end, we separated the models in the low-metallicity regime (Z = 0.00135, 0.00061, 0.00043, 0.00014)5 and the high-metallicity regime (Z = 0.01300, 0.00834, 0.00424)5 and obtained their PLZ relations, the results of which are listed in Table 7. The metallicity coefficients of the PW relations using the Gaia passbands are mostly consistent with zero within 3σ uncertainties for the BL Her models in the low-metallicity regime, but clearly exhibit a small but significant and negative metallicity coefficient for the BL Her models in the high-metallicity regime, thereby contributing to an overall small metallicity effect when considering the complete set of BL Her models. A possible explanation for the difference in the behaviour of the metallicity contributions in the different metallicity regimes could be because of the increased sensitivity of bolometric corrections to metallicities at wavelengths shorter than the V band (Gray 2005; Kudritzki et al. 2008). Although beyond the scope of the present study, it would be important to investigate the effect of the different model atmospheres and their subsequent impact on the transformations of the bolometric light curves in the future.
PLZ relations for BL Her models of the mathematical form Mλ = α + βlog(P)+γ[Fe/H] in the low- and the high-metallicity regimes for different wavelengths using different convective parameter sets.
The contribution of the γ term (metallicity effect) obtained from the theoretical PLZ relations for BL Her models computed using the convection parameter set A is displayed in Fig. 4 as a function of wavelength. The γ terms for the PLZ/PWZ relations in the Gaia passbands are obtained from this present analysis. In addition, we use the γ terms for the PLZ relations in the bolometric and the Johnson-Cousins-Glass (UBVRIJHKLL′M) bands from Paper I. WGaia represents the Gaia Wesenheit magnitude W(G, GBP − GRP) = G − 1.90(GBP − GRP) (Ripepi et al. 2019) while WVI = I − 1.55(V − I) (Inno et al. 2013). From Fig. 4, we find that the metallicity coefficient in the high-metallicity regime is indeed much stronger as compared to the low-metallicity regime at wavelengths shorter than V band, with the strongest effect at U and B bands.
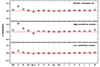 |
Fig. 4. Contribution of the γ term (metallicity effect) obtained from the theoretical PLZ relations for BL Her models computed using the convection parameter set A across the bolometric (Bol), Johnson-Cousins-Glass (UBVRIJHKLL′M) and Gaia (GGBPGRP) passbands. WGaia represents the Gaia Wesenheit magnitude W(G, GBP − GRP). The different panels present results from the complete set of models compared with the high-metallicity models (Z = 0.00424, 0.00834, 0.01300) and the low-metallicity models (Z = 0.00014, 0.00043, 0.00061, 0.00135). The x-axis is in increasing order of the central effective wavelengths (λeff) of the respective passbands as provided by the SVO Filter Profile Service (Rodrigo et al. 2012; Rodrigo & Solano 2020). |
4. Mass-luminosity relations
We explore the dependence of the mass-luminosity (ML) relation on metallicity in our BL Her models, following the work of Bono et al. (2020), where they found a marginal effect of metallicity on the ML relation of T2Cs. To test for the effect of metallicity on the ML relations, we derive MLZ relations in the form:
![$$ \begin{aligned} W=\alpha^\prime + \beta^\prime \log (M/M_{\odot })+\gamma^\prime \mathrm{[Fe/H]} ,\end{aligned} $$](/articles/aa/full_html/2024/04/aa48280-23/aa48280-23-eq21.gif)
for the four different convection parameter sets, where W is the Wesenheit magnitude using the Gaia passbands, as defined in Eq. (8). We find the following relations for set A:
![$$ \begin{aligned} \begin{aligned} W=&-(2.614 \pm 0.022)-(2.487 \pm 0.107)\log (M/M_{\odot })\\&-(0.150 \pm 0.010)\mathrm{[Fe/H]} \quad (N=3266; \sigma =0.399), \end{aligned} \end{aligned} $$](/articles/aa/full_html/2024/04/aa48280-23/aa48280-23-eq22.gif)
for set B:
![$$ \begin{aligned} \begin{aligned} W=&-(2.492 \pm 0.027)-(2.283 \pm 0.129)\log (M/M_{\odot })\\&-(0.131 \pm 0.012)\mathrm{[Fe/H]} \quad (N=2260; \sigma =0.397), \end{aligned} \end{aligned} $$](/articles/aa/full_html/2024/04/aa48280-23/aa48280-23-eq23.gif)
for set C:
![$$ \begin{aligned} \begin{aligned} W=&-(2.614 \pm 0.026)-(2.395 \pm 0.124)\log (M/M_{\odot })\\&-(0.191 \pm 0.012)\mathrm{[Fe/H]} \quad (N=2632; \sigma =0.414), \end{aligned} \end{aligned} $$](/articles/aa/full_html/2024/04/aa48280-23/aa48280-23-eq24.gif)
and for set D:
![$$ \begin{aligned} \begin{aligned} W=&-(2.511 \pm 0.029)-(2.141 \pm 0.140)\log (M/M_{\odot })\\&-(0.156 \pm 0.013)\mathrm{[Fe/H]} \quad (N=2122; \sigma =0.418). \end{aligned} \end{aligned} $$](/articles/aa/full_html/2024/04/aa48280-23/aa48280-23-eq25.gif)
The coefficients of the metallicity term from Eqs. (13)–(16) indeed suggest a dependence of the ML relations on the chemical composition. The above relations are obtained for the entire set of BL Her models with the mass range 0.5 − 0.8 M⊙. We also tested for the subset of BL Her models with the mass range 0.5 − 0.6 M⊙ and found similar results indicating a dependence of the ML relation on metallicity. However, we note here that the MLZ relations exhibit quite a large scatter.
5. Fourier parameters
The variation of the Fourier amplitude (R21 and R31) and phase (ϕ21 and ϕ31) parameters from the theoretical BL Her light curves in the G band is presented in Fig. 5 as a function of period and convection parameter sets. The observed G band Fourier parameters from BL Her stars in the All Sky region from Gaia DR3 are also over-plotted. We find that the observed Fourier parameter space is well-covered by our BL Her models. However, the models also produce Fourier amplitude parameters (R21 and R31) that are considerably larger than what is observed. While this holds true for all the four sets of convection parameters, subtle differences exist among the four sets of convection parameters. For example, in the range of 0.4 < log(P) < 0.5, the mean values (with corresponding standard deviations on the mean value within the period bin) are 0.377±0.123 for set A, 0.361±0.138 for set B, 0.314±0.119 for set C and 0.280±0.118 for set D. The corresponding values of R31 are 0.196±0.104 for set A, 0.213±0.117 for set B, 0.167±0.090 for set C, and 0.202±0.090 for set D. The choice of convection parameters therefore clearly play an important role in the theoretical light curve structures, especially on the Fourier amplitude parameters (also see Kovács et al. 2023). Adopting a higher mixing length (see e.g. Marconi & Clementini 2005; Marconi & Di Criscienzo 2007; Netzel et al. 2023 for RR Lyraes, Marconi et al. 2013a,b for classical Cepheids and review by Joyce & Tayar 2023) or different opacity values (Kanbur et al. 2018) may help resolve some of the discrepancies related to the Fourier amplitude parameters. We emphasize here that the convection parameter sets used in this analysis are the same as those outlined in Paxton et al. (2019), without any changes to the free convection parameters.
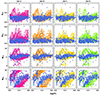 |
Fig. 5. Variation in the Fourier parameters of BL Her models in the G band as a function of period and the convective parameter sets A (pink), B (orange), C (yellow), and D (green). Fourier parameters from the BL Her stars in the All Sky region from Gaia DR3 are over-plotted (in navy crosses) for an easier comparison with the theoretical Fourier parameter space. |
Since BL Her stars are mostly considered to be low-mass stars, we also present the comparison of the Fourier parameters of the BL Her stars from Gaia DR3 with those from the subset of low-mass models (0.5 − 0.6 M⊙) computed using the convection parameter set C in Fig. 6. The theoretical Fourier parameters are displayed in yellow circles while the observed Fourier parameters from the All Sky and the Magellanic Clouds are shown in navy, red, and black crosses, respectively. We find two interesting results. For the Magellanic Clouds, the observed G-band Fourier parameter space for BL Her stars is still covered well by the theoretical Fourier amplitude (R21 and R31) and phase (ϕ21 and ϕ31) parameter space of the low-mass models. In contrast, we observe a lack of models corresponding to a subset of BL Her stars in the All Sky region (see, for example, the shaded region displaying the observed ϕ31 parameters of BL Her stars in the All Sky region around log(P) = 0.15). This could indicate the need for higher mass models (> 0.6 M⊙) to reliably model the observed light curves of BL Her stars in the All Sky region.
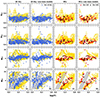 |
Fig. 6. Variation in the Fourier parameters of BL Her models (displayed in yellow) in the G band computed using the convection parameter set C as a function of stellar mass and period. Low mass models indicate models with M ≤ 0.6 M⊙. The grey shaded regions in the lowermost panels highlight that while low-mass models may suffice to model BL Her stars in the Magellanic Clouds (sub-plots c, d), higher mass models may be needed to reliably model BL Her stars in the All Sky region (sub-plots a, b). |
We probe this further in Fig. 7, where we compare the Fourier parameters from observed BL Her stars in the All Sky region with those from low-mass (M ≤ 0.6 M⊙) and high-mass models (M > 0.6 M⊙). The regions bounded by red in Fig. 7 highlight the lack of low-mass models not only with respect to the ϕ31 parameter, but also to the R31 parameter. These regions exhibit the presence of observed Fourier parameters from the All Sky BL Her stars, as well as theoretical Fourier parameters from BL Her models with stellar mass M > 0.6 M⊙. However, further investigations using a more rigorous comparison of theoretical-observed light curve pairs are required to support our claim for the need of higher mass models corresponding to BL Her stars in the All-Sky region.
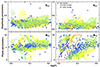 |
Fig. 7. Comparison of the theoretical Fourier parameters from the low-mass (M ≤ 0.6 M⊙; green) and the high-mass models (M > 0.6 M⊙; yellow) with the observed Fourier parameters of BL Her stars in the All Sky region (displayed in navy). The regions marked with red highlight the presence of observed Fourier parameters but the lack of those from low-mass models. |
6. Summary and conclusion
We extended the fine grid of BL Her models computed using MESA-RSP, the state-of-the-art 1D stellar pulsation code (Paxton et al. 2019) in Paper I to obtain theoretical light curves in the Gaia passbands (G, GBP, GRP) and carried out a comparative analysis with the observed light curves of BL Her stars from Gaia DR3. The grid of models encompasses a wide range of input parameters: metallicity (−2.0 dex ≤ [Fe/H] ≤ 0.0 dex)6, stellar mass (0.5–0.8 M⊙), stellar luminosity (50–300 L⊙), and effective temperature (full extent of the instability strip in steps of 50 K; 5900–7200 K for 50 L⊙ and 4700–6550 K for 300 L⊙) and is computed using the four sets of convection parameters as outlined in Paxton et al. (2019). The input stellar parameters (ZXMLTeff) chosen are typical for BL Her stars (see e.g. Buchler & Moskalik 1992; Marconi & Di Criscienzo 2007; Smolec 2016). The BL Her models we selected to use in this analysis exhibit positive growth rates in the fundamental mode with pulsation periods between one and four days and fulfill the condition of full-amplitude stable pulsations.
In this way, we derived the theoretical PL and PW relations for these models in the Gaia passbands and studied the effect of metallicity and convection parameters on these relations at mean light. We subsequently carried out a comparison of the light curve structures between the models and the Gaia DR3 data of BL Her stars with respect to their Fourier parameters. The important results from this analysis are summarized below:
-
We found statistically similar PL and PW slopes as a function of convection parameters across all Gaia passbands for the complete set of BL Her models computed using radiative cooling (sets B and D).
-
The All-Sky BL Her stars exhibit statistically different PL slopes compared to the theoretical PL slopes computed using the four sets of convection parameters. However, the empirical PW relations from the All Sky BL Her stars mostly exhibit statistically similar slopes with the theoretical PW slopes computed using the four sets of convection parameters, with a few exceptions.
-
The empirical PL and PW slopes from the Magellanic Cloud BL Her stars are mostly statistically similar with the theoretical relations computed using the different convection parameter sets across all the Gaia passbands.
-
The theoretical PL relations in the Gaia passbands for BL Her models exhibit steeper slopes and smaller dispersion with increasing wavelengths (GBP < G < GRP). This result is consistent with the theoretical relations for the Johnson-Cousin-Glass bands (UBVRIJHKLL′M) in Paper I.
-
For both the complete set of models and the low-mass models only, we find the metallicity contribution to the PLZ relations to be negligible within 3σ uncertainties, except for a few cases using GRP.
-
We find a small but significant negative coefficient of metallicity in the PWZ relations for the BL Her models using the four sets of convection parameters.
-
The small but significant metallicity contribution in the Wesenheit relations arises from the high metallicity BL Her models and could be a result of the increased sensitivity of bolometric corrections to metallicities at wavelengths shorter than the V band (Gray 2005; Kudritzki et al. 2008).
-
The computed BL Her models suggest a dependence of the ML relation on chemical composition. This is in agreement with Bono et al. (2020) where they found a marginal dependence of the ML relation of T2Cs on metallicity.
-
The observed Fourier parameter space is well-covered by our BL Her models. However, the models have much larger Fourier amplitude parameters (R21 and R31) than what is observed.
-
For the Magellanic Clouds, the observed Fourier parameter space for BL Her stars is still covered well by the Fourier parameter space of the low-mass models (≤0.6 M⊙). Higher mass models (> 0.6 M⊙) may be needed to reliably model the observed light curves of BL Her stars in the All Sky region. However, further investigation is required to support this claim.
In this work, we have used the MESA-RSP code, which computes non-linear radial stellar pulsations using the input stellar parameters (ZXMLTeff) typical for BL Her stars. As noted in Smolec & Moskalik (2008), these input parameters can be chosen without being bound by evolutionary tracks. The recent work by Bono et al. (2020) offers us an opportunity to compute evolutionary tracks of T2Cs using the evolutionary code of MESA and compare the two different approaches. Although this is beyond the scope of the present study, it is indeed interesting for a future project.
Our grid of BL Her models ushers in the era of large number statistics on the theoretical front in the study of stellar pulsations. However, note that this analysis uses the four convection parameter sets as outlined in Paxton et al. (2019); these convection parameter values are merely useful starting choices. Our grid of models suggests that the choice of convection parameters clearly play an important role in the theoretical light curve structures, especially on the Fourier amplitude parameters and therefore, may be reasonably changed to obtain better fitted models for a particular observed light curve. As an application of our extensive light curve analysis, we compared the theoretical and observed light curves of the BL Her stars in the LMC with similar periods and obtained the best-fit models in an ongoing project (Das et al., Paper III, in prep.). We note here that the theoretical Fourier parameter space from our present grid of BL Her models is much larger than the observed Fourier parameter space. As an inverse method of stellar population synthesis, a comparison between the theoretical PL and PW relations obtained from the subset of the best-matched observed-model pairs for the BL Her stars in the LMC and the theoretical relations from the complete set of BL Her models would thus be of critical importance.
The results demonstrate that the empirical PL and PW relations from the BL Her stars in the Magellanic Clouds and show statistically similar slopes with those from models across the four different sets of convection parameters; however, the theoretical slopes from the different convection sets themselves exhibit statistical differences amongst each other indicate that the observations are not yet precise enough to distinguish among the models with different convection parameter sets. It is also important to note that the theoretical and the empirical PL and PW relations have been compared at mean light, which exhibits a behaviour averaged over a pulsation cycle. In the era of percent-level precision, it is therefore important to compare the observations and the stellar pulsation models not just at mean light but above and beyond with respect to their light curve structures over a complete pulsation cycle. In light of this, we also plan to carry out a multiphase study (for classical Cepheids, see Kurbah et al. 2023) for our grid of BL Her models in the near future.
The MESA inlists used for computing the BL Her models in the Gaia passbands may be found in https://doi.org/10.5281/zenodo.10404005
For a detailed list of the changes in the different versions of MESA, the interested reader is referred to https://docs.mesastar.org/en/release-r23.05.1/changelog.html
The observed data from Gaia DR3 used in this work are available at https://gea.esac.esa.int/archive/
For equivalent [Fe/H] range, see Table 1.
For equivalent Z range, see Table 1.
Acknowledgments
The authors thank the referee for useful comments and suggestions that improved the quality of the manuscript. S.D. expresses her heartfelt gratitude to Zsófia Fejes (HR generalist, CSFK) for her continuous support throughout that made this project work smoother. S.D. and L.M. acknowledge the KKP-137523 ‘SeismoLab’ Élvonal grant of the Hungarian Research, Development and Innovation Office (NKFIH). M.J. gratefully acknowledges funding from MATISSE: Measuring Ages Through Isochrones, Seismology, and Stellar Evolution, awarded through the European Commission’s Widening Fellowship. This project has received funding from the European Union’s Horizon 2020 research and innovation program. R.S. is supported by the Polish National Science Centre, SONATA BIS grant, 2018/30/E/ST9/00598. The authors acknowledge the use of High Performance Computing facility Pegasus at IUCAA, Pune as well as at the HUN-REN (formerly ELKH) Cloud and the following software used in this project: MESA r11701 (Paxton et al. 2011, 2013, 2015, 2018, 2019). This research has made use of the Spanish Virtual Observatory (https://svo.cab.inta-csic.es) project funded by MCIN/AEI/10.13039/501100011033/ through grant PID2020-112949GB-I00. This research has made use of NASA’s Astrophysics Data System.
References
- Alexander, A. L., Joner, M. D., & McNamara, D. H. 1987, PASP, 99, 645 [NASA ADS] [CrossRef] [Google Scholar]
- Asplund, M., Grevesse, N., Sauval, A. J., & Scott, P. 2009, ARA&A, 47, 481 [NASA ADS] [CrossRef] [Google Scholar]
- Baart, M. L. 1982, IMA J. Numerical Anal., 2, 241 [CrossRef] [Google Scholar]
- Beaton, R. L., Bono, G., Braga, V. F., et al. 2018, SSRv, 214, 113 [NASA ADS] [Google Scholar]
- Bhardwaj, A. 2020, J. Astrophys. Astron., 41, 23 [NASA ADS] [CrossRef] [Google Scholar]
- Bhardwaj, A., Kanbur, S. M., Macri, L. M., et al. 2016, AJ, 151, 88 [NASA ADS] [CrossRef] [Google Scholar]
- Bhardwaj, A., Kanbur, S. M., Marconi, M., et al. 2017a, MNRAS, 466, 2805 [NASA ADS] [CrossRef] [Google Scholar]
- Bhardwaj, A., Macri, L. M., Rejkuba, M., et al. 2017b, AJ, 153, 154 [NASA ADS] [CrossRef] [Google Scholar]
- Bhardwaj, A., Rejkuba, M., Minniti, D., et al. 2017c, A&A, 605, A100 [NASA ADS] [CrossRef] [EDP Sciences] [Google Scholar]
- Bhardwaj, A., Riess, A. G., Catanzaro, G., et al. 2023, ApJ, 955, L13 [NASA ADS] [CrossRef] [Google Scholar]
- Bono, G., Castellani, V., & Stellingwerf, R. F. 1995, ApJ, 445, L145 [NASA ADS] [CrossRef] [Google Scholar]
- Bono, G., Caputo, F., Cassisi, S., Castellani, V., & Marconi, M. 1997a, ApJ, 489, 822 [NASA ADS] [CrossRef] [Google Scholar]
- Bono, G., Caputo, F., & Santolamazza, P. 1997b, A&A, 317, 171 [NASA ADS] [Google Scholar]
- Bono, G., Braga, V. F., Fiorentino, G., et al. 2020, A&A, 644, A96 [NASA ADS] [CrossRef] [EDP Sciences] [Google Scholar]
- Braga, V. F., Bhardwaj, A., Contreras Ramos, R., et al. 2018, A&A, 619, A51 [NASA ADS] [CrossRef] [EDP Sciences] [Google Scholar]
- Braga, V. F., Bono, G., Fiorentino, G., et al. 2020, A&A, 644, A95 [NASA ADS] [CrossRef] [EDP Sciences] [Google Scholar]
- Breuval, L., Riess, A. G., Kervella, P., Anderson, R. I., & Romaniello, M. 2022, ApJ, 939, 89 [NASA ADS] [CrossRef] [Google Scholar]
- Buchler, J. R., & Moskalik, P. 1992, ApJ, 391, 736 [NASA ADS] [CrossRef] [Google Scholar]
- Caputo, F. 1998, A&ARv., 9, 33 [NASA ADS] [CrossRef] [Google Scholar]
- Catelan, M., Pritzl, B. J., & Smith, H. A. 2004, ApJS, 154, 633 [Google Scholar]
- Das, S., Bhardwaj, A., Kanbur, S. M., Singh, H. P., & Marconi, M. 2018, MNRAS, 481, 2000 [CrossRef] [Google Scholar]
- Das, S., Kanbur, S. M., Bellinger, E. P., et al. 2020, MNRAS, 493, 29 [NASA ADS] [CrossRef] [Google Scholar]
- Das, S., Kanbur, S. M., Smolec, R., et al. 2021, MNRAS, 501, 875 [Google Scholar]
- Deb, S., & Singh, H. P. 2009, A&A, 507, 1729 [NASA ADS] [CrossRef] [EDP Sciences] [Google Scholar]
- Deb, S., & Singh, H. P. 2010, MNRAS, 402, 691 [NASA ADS] [CrossRef] [Google Scholar]
- De Somma, G., Marconi, M., Molinaro, R., et al. 2022, ApJS, 262, 25 [NASA ADS] [CrossRef] [Google Scholar]
- Di Criscienzo, M., Caputo, F., Marconi, M., & Cassisi, S. 2007, A&A, 471, 893 [NASA ADS] [CrossRef] [EDP Sciences] [Google Scholar]
- Eyer, L., Audard, M., Holl, B., et al. 2023, A&A, 674, A13 [NASA ADS] [CrossRef] [EDP Sciences] [Google Scholar]
- Gaia Collaboration (Brown, A. G. A., et al.) 2016a, A&A, 595, A2 [NASA ADS] [CrossRef] [EDP Sciences] [Google Scholar]
- Gaia Collaboration (Prusti, T., et al.) 2016b, A&A, 595, A1 [NASA ADS] [CrossRef] [EDP Sciences] [Google Scholar]
- Gaia Collaboration (Brown, A. G. A., et al.) 2018, A&A, 616, A1 [NASA ADS] [CrossRef] [EDP Sciences] [Google Scholar]
- Gaia Collaboration (Brown, A. G. A., et al.) 2021, A&A, 649, A1 [NASA ADS] [CrossRef] [EDP Sciences] [Google Scholar]
- Gaia Collaboration (Vallenari, A., et al.) 2023, A&A, 674, A1 [NASA ADS] [CrossRef] [EDP Sciences] [Google Scholar]
- Gingold, R. A. 1985, MmSAI, 56, 169 [NASA ADS] [Google Scholar]
- Gray, D. F. 2005, The Observation and Analysis of Stellar Photospheres (Cambridge, UK: Cambridge University Press) [Google Scholar]
- Groenewegen, M. A. T., & Jurkovic, M. I. 2017, A&A, 604, A29 [NASA ADS] [CrossRef] [EDP Sciences] [Google Scholar]
- Hidalgo, S. L., Pietrinferni, A., Cassisi, S., et al. 2018, ApJ, 856, 125 [Google Scholar]
- Hinshaw, G., Larson, D., Komatsu, E., et al. 2013, ApJS, 208, 19 [Google Scholar]
- Inno, L., Matsunaga, N., Bono, G., et al. 2013, ApJ, 764, 84 [Google Scholar]
- Joyce, M., & Tayar, J. 2023, Galaxies, 11, 75 [NASA ADS] [CrossRef] [Google Scholar]
- Jurkovic, M. I., Plachy, E., Molnár, L., et al. 2023, MNRAS, 518, 642 [Google Scholar]
- Kanbur, S. M., Marconi, M., Bhardwaj, A., Kundu, R., & Singh, H. P. 2018, ASP Conf. Ser., 515, 189 [NASA ADS] [Google Scholar]
- Kovács, G. B., Nuspl, J., & Szabó, R. 2023, MNRAS, 521, 4878 [CrossRef] [Google Scholar]
- Kudritzki, R.-P., Urbaneja, M. A., Bresolin, F., et al. 2008, ApJ, 681, 269 [NASA ADS] [CrossRef] [Google Scholar]
- Kuhfuss, R. 1986, A&A, 160, 116 [NASA ADS] [Google Scholar]
- Kurbah, K., Deb, S., Kanbur, S. M., et al. 2023, MNRAS, 521, 6034 [CrossRef] [Google Scholar]
- Kurucz, R. L. 1970, SAO Special Report, 309 [Google Scholar]
- Kurucz, R. L. 1993, SYNTHE Spectrum Synthesis Programs and Line Data (Cambridge, Mass.: Smithsonian Astrophysical Observatory) [Google Scholar]
- Lejeune, T., Cuisinier, F., & Buser, R. 1998, A&AS, 130, 65 [NASA ADS] [CrossRef] [EDP Sciences] [Google Scholar]
- Madore, B. F. 1982, ApJ, 253, 575 [NASA ADS] [CrossRef] [Google Scholar]
- Madore, B. F., & Freedman, W. L. 2012, ApJ, 744, 132 [NASA ADS] [CrossRef] [Google Scholar]
- Majaess, D. J. 2010, J. Am. Assoc. Variable Star Obs. (JAAVSO), 38, 100 [NASA ADS] [Google Scholar]
- Marconi, M., & Clementini, G. 2005, AJ, 129, 2257 [Google Scholar]
- Marconi, M., & Di Criscienzo, M. 2007, A&A, 467, 223 [EDP Sciences] [Google Scholar]
- Marconi, M., Molinaro, R., Bono, G., et al. 2013a, ApJ, 768, L6 [Google Scholar]
- Marconi, M., Molinaro, R., Ripepi, V., Musella, I., & Brocato, E. 2013b, MNRAS, 428, 2185 [Google Scholar]
- Marconi, M., Coppola, G., Bono, G., et al. 2015, ApJ, 808, 50 [Google Scholar]
- Marconi, M., Molinaro, R., Ripepi, V., et al. 2017, MNRAS, 466, 3206 [NASA ADS] [CrossRef] [Google Scholar]
- Matsunaga, N., Fukushi, H., Nakada, Y., et al. 2006, MNRAS, 370, 1979 [Google Scholar]
- Matsunaga, N., Feast, M. W., & Menzies, J. W. 2009, MNRAS, 397, 933 [NASA ADS] [CrossRef] [Google Scholar]
- Matsunaga, N., Feast, M. W., & Soszyński, I. 2011, MNRAS, 413, 223 [Google Scholar]
- Neeley, J. R., Marengo, M., Bono, G., et al. 2017, ApJ, 841, 84 [Google Scholar]
- Netzel, H., Molnár, L., & Joyce, M. 2023, MNRAS, 525, 5378 [NASA ADS] [CrossRef] [Google Scholar]
- Ngeow, C.-C., Sarkar, S., Bhardwaj, A., Kanbur, S. M., & Singh, H. P. 2015, ApJ, 813, 57 [NASA ADS] [CrossRef] [Google Scholar]
- Ngeow, C.-C., Bhardwaj, A., Henderson, J.-Y., et al. 2022, AJ, 164, 154 [NASA ADS] [CrossRef] [Google Scholar]
- Paxton, B., Bildsten, L., Dotter, A., et al. 2011, ApJS, 192, 3 [Google Scholar]
- Paxton, B., Cantiello, M., Arras, P., et al. 2013, ApJS, 208, 4 [Google Scholar]
- Paxton, B., Marchant, P., Schwab, J., et al. 2015, ApJS, 220, 15 [Google Scholar]
- Paxton, B., Schwab, J., Bauer, E. B., et al. 2018, ApJS, 234, 34 [NASA ADS] [CrossRef] [Google Scholar]
- Paxton, B., Smolec, R., Schwab, J., et al. 2019, ApJS, 243, 10 [Google Scholar]
- Petersen, J. O. 1986, A&A, 170, 59 [NASA ADS] [Google Scholar]
- Posten, H. O. 1984, in Robustness of the Two-Sample T-Test, eds. D. Rasch, & M. L. Tiku (Dordrecht, Netherlands: Springer), 92 [Google Scholar]
- Ripepi, V., Moretti, M. I., Marconi, M., et al. 2015, MNRAS, 446, 3034 [NASA ADS] [CrossRef] [Google Scholar]
- Ripepi, V., Molinaro, R., Musella, I., et al. 2019, A&A, 625, A14 [NASA ADS] [CrossRef] [EDP Sciences] [Google Scholar]
- Ripepi, V., Catanzaro, G., Molinaro, R., et al. 2021, MNRAS, 508, 4047 [NASA ADS] [CrossRef] [Google Scholar]
- Ripepi, V., Catanzaro, G., Clementini, G., et al. 2022, A&A, 659, A167 [NASA ADS] [CrossRef] [EDP Sciences] [Google Scholar]
- Ripepi, V., Clementini, G., Molinaro, R., et al. 2023, A&A, 674, A17 [NASA ADS] [CrossRef] [EDP Sciences] [Google Scholar]
- Rodrigo, C., & Solano, E. 2020, in XIV.0 ScientificMeeting (virtual) of the Spanish Astronomical Society, 182 [Google Scholar]
- Rodrigo, C., Solano, E., & Bayo, A. 2012, SVO Filter Profile Service Version 1.0, IVOA Working Draft 15 October 2012 [Google Scholar]
- Sandage, A., & Tammann, G. A. 2006, ARA&A, 44, 93 [NASA ADS] [CrossRef] [Google Scholar]
- Simon, N. R. 1985, ApJ, 299, 723 [NASA ADS] [CrossRef] [Google Scholar]
- Smolec, R. 2016, MNRAS, 456, 3475 [NASA ADS] [CrossRef] [Google Scholar]
- Smolec, R., & Moskalik, P. 2008, Acta Astron., 58, 193 [NASA ADS] [Google Scholar]
- Smolec, R., & Moskalik, P. 2012, MNRAS, 426, 108 [NASA ADS] [CrossRef] [Google Scholar]
- Smolec, R., & Moskalik, P. 2014, MNRAS, 441, 101 [CrossRef] [Google Scholar]
- Smolec, R., Soszyński, I., Moskalik, P., et al. 2012, MNRAS, 419, 2407 [CrossRef] [Google Scholar]
- Soszyński, I., Udalski, A., Szymański, M. K., et al. 2008, Acta Astron., 58, 293 [NASA ADS] [Google Scholar]
- Soszyński, I., Udalski, A., Pietrukowicz, P., et al. 2011, Acta Astron., 61, 285 [NASA ADS] [Google Scholar]
- Soszyński, I., Udalski, A., Szymański, M. K., et al. 2018, Acta Astron., 68, 89 [NASA ADS] [Google Scholar]
- Soszyński, I., Smolec, R., Udalski, A., & Pietrukowicz, P. 2019, ApJ, 873, 43 [CrossRef] [Google Scholar]
- Trentin, E., Ripepi, V., Molinaro, R., et al. 2024, A&A, 681, A65 [NASA ADS] [CrossRef] [EDP Sciences] [Google Scholar]
- Wallerstein, G. 2002, PASP, 114, 689 [Google Scholar]
- Wielgórski, P., Pietrzyński, G., Pilecki, B., et al. 2022, ApJ, 927, 89 [CrossRef] [Google Scholar]
Appendix A: Number of BL Her models computed
A summary of the number of BL Her models in each convection parameter set used in the analysis is presented in Table A.1. We also refer to Section 2 of Paper I for more details.
Summary of the number of BL Her models in each convection parameter set used in the analysis.
Appendix B: Theoretical PL and PW slopes as a function of chemical composition
A comparison of the PL and PW slopes of the BL Her models as a function of chemical composition across different wavelengths for the four sets of convective parameters is presented in Fig. B.1.
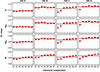 |
Fig. B.1. Comparison of the PL and PW slopes of the BL Her models as a function of chemical composition (Z1 = 0.01300, Z2 = 0.00834, Z3 = 0.00424, Z4 = 0.00135, Z5 = 0.00061, Z6 = 0.00043, Z70.00014) across different wavelengths for the convective parameter sets A, B, C, and D. The horizontal lines represent the mean values of the slopes in the individual sub-plots. The y-scale is same (1 unit) in each panel for a relative comparison. |
Appendix C: Comparison of the theoretical PL and PW relations using linear and non-linear pulsation periods
A comparison of the theoretical PL and PW relations for BL Her models of the mathematical form Mλ = alog(P)+b using linear and non-linear pulsation periods is presented in Table C.1.
Comparison of the theoretical PL and PW relations for BL Her models of the mathematical form Mλ = alog(P)+b for the complete set of models using linear and non-linear pulsation periods. N is the total number of models.
All Tables
Light curve parameters of the BL Her models used in this analysis computed using MESA-RSP (extract).
Number of observed BL Her stars with epoch photometry data in the Gaia passbands from the Gaia DR3 catalogue in the All Sky, LMC, and SMC sub-regions.
Comparison of the slopes of the PL and PW relations for BL Her stars of the mathematical form Mλ = alog(P)+b.
PLZ relations for BL Her models of the mathematical form Mλ = α + βlog(P)+γ[Fe/H] for different wavelengths using different convective parameter sets.
PLZ relations for BL Her models of the mathematical form Mλ = α + βlog(P)+γ[Fe/H] in the low- and the high-metallicity regimes for different wavelengths using different convective parameter sets.
Summary of the number of BL Her models in each convection parameter set used in the analysis.
Comparison of the theoretical PL and PW relations for BL Her models of the mathematical form Mλ = alog(P)+b for the complete set of models using linear and non-linear pulsation periods. N is the total number of models.
All Figures
|
Fig. 1. Light curves in the bolometric, G, GBP, and GRP bands (shown from top to bottom) for a BL Her model with input parameters, Z = 0.00043, X = 0.75041, M = 0.6 M⊙, L = 100 L⊙, and T = 6700 K computed using four sets of convection parameters (sets A, B, C, and D depicted in different colours). Light curves are vertically offset by 0.5 mag successively for visualisation purposes. The light curves in the foreground are computed using MESA r11701 and used in this analysis while the corresponding light curves depicted in the background are computed using the latest version, MESA r23.05.1. |
| In the text | |
|
Fig. 2. PL and PW relations of the BL Her models with different chemical compositions across different wavelengths for the convective parameter sets A, B, C, and D. |
| In the text | |
|
Fig. 3. Comparison of the theoretical PL and PW slopes of the BL Her models computed using the complete range of metallicities (−2.0 dex ≤ [Fe/H] ≤ 0.0 dex), with the empirical slopes spread across the different Gaia wavelengths. The y-scale is same (5 units) in each panel for a relative comparison. Note: the empirical PL slopes in the Gaia passbands are obtained using apparent magnitudes not corrected for extinction. |
| In the text | |
|
Fig. 4. Contribution of the γ term (metallicity effect) obtained from the theoretical PLZ relations for BL Her models computed using the convection parameter set A across the bolometric (Bol), Johnson-Cousins-Glass (UBVRIJHKLL′M) and Gaia (GGBPGRP) passbands. WGaia represents the Gaia Wesenheit magnitude W(G, GBP − GRP). The different panels present results from the complete set of models compared with the high-metallicity models (Z = 0.00424, 0.00834, 0.01300) and the low-metallicity models (Z = 0.00014, 0.00043, 0.00061, 0.00135). The x-axis is in increasing order of the central effective wavelengths (λeff) of the respective passbands as provided by the SVO Filter Profile Service (Rodrigo et al. 2012; Rodrigo & Solano 2020). |
| In the text | |
|
Fig. 5. Variation in the Fourier parameters of BL Her models in the G band as a function of period and the convective parameter sets A (pink), B (orange), C (yellow), and D (green). Fourier parameters from the BL Her stars in the All Sky region from Gaia DR3 are over-plotted (in navy crosses) for an easier comparison with the theoretical Fourier parameter space. |
| In the text | |
|
Fig. 6. Variation in the Fourier parameters of BL Her models (displayed in yellow) in the G band computed using the convection parameter set C as a function of stellar mass and period. Low mass models indicate models with M ≤ 0.6 M⊙. The grey shaded regions in the lowermost panels highlight that while low-mass models may suffice to model BL Her stars in the Magellanic Clouds (sub-plots c, d), higher mass models may be needed to reliably model BL Her stars in the All Sky region (sub-plots a, b). |
| In the text | |
|
Fig. 7. Comparison of the theoretical Fourier parameters from the low-mass (M ≤ 0.6 M⊙; green) and the high-mass models (M > 0.6 M⊙; yellow) with the observed Fourier parameters of BL Her stars in the All Sky region (displayed in navy). The regions marked with red highlight the presence of observed Fourier parameters but the lack of those from low-mass models. |
| In the text | |
|
Fig. B.1. Comparison of the PL and PW slopes of the BL Her models as a function of chemical composition (Z1 = 0.01300, Z2 = 0.00834, Z3 = 0.00424, Z4 = 0.00135, Z5 = 0.00061, Z6 = 0.00043, Z70.00014) across different wavelengths for the convective parameter sets A, B, C, and D. The horizontal lines represent the mean values of the slopes in the individual sub-plots. The y-scale is same (1 unit) in each panel for a relative comparison. |
| In the text | |
Current usage metrics show cumulative count of Article Views (full-text article views including HTML views, PDF and ePub downloads, according to the available data) and Abstracts Views on Vision4Press platform.
Data correspond to usage on the plateform after 2015. The current usage metrics is available 48-96 hours after online publication and is updated daily on week days.
Initial download of the metrics may take a while.