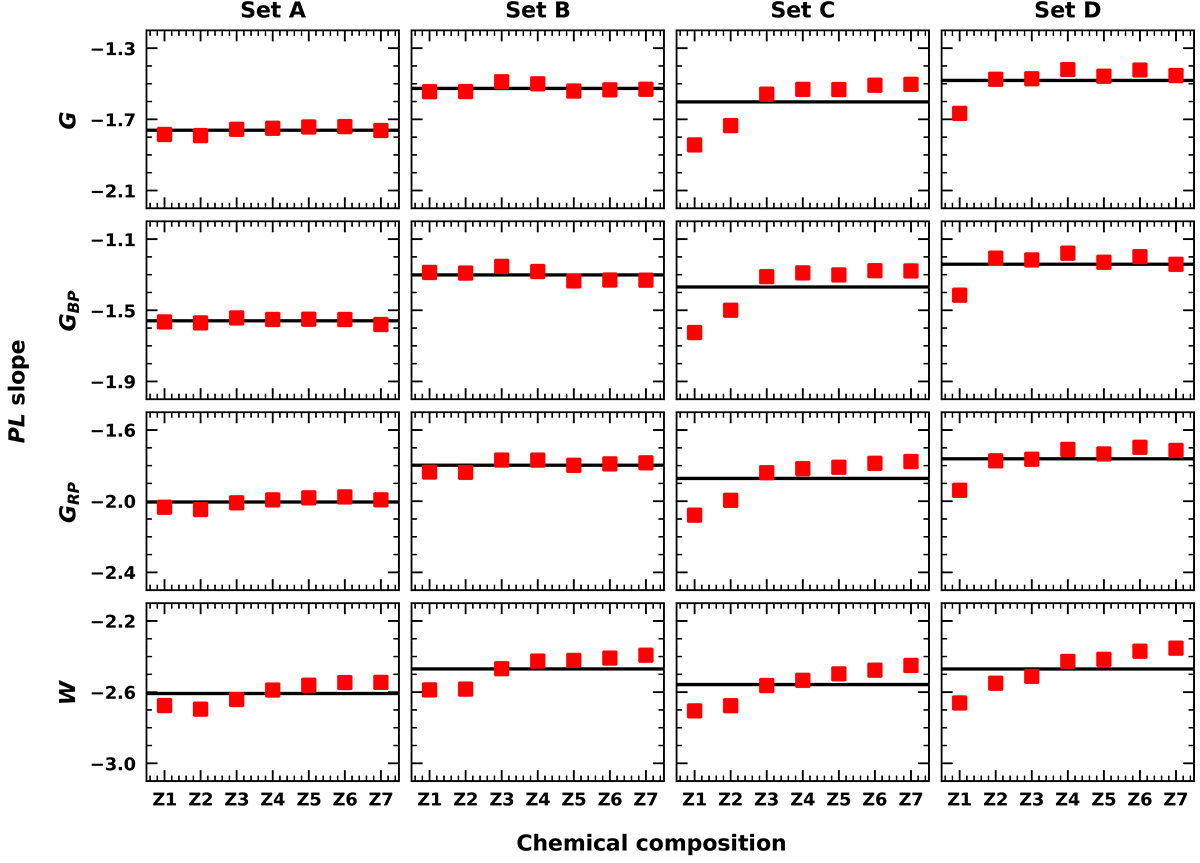
Fig. B.1.
Download original image
Comparison of the PL and PW slopes of the BL Her models as a function of chemical composition (Z1 = 0.01300, Z2 = 0.00834, Z3 = 0.00424, Z4 = 0.00135, Z5 = 0.00061, Z6 = 0.00043, Z70.00014) across different wavelengths for the convective parameter sets A, B, C, and D. The horizontal lines represent the mean values of the slopes in the individual sub-plots. The y-scale is same (1 unit) in each panel for a relative comparison.
Current usage metrics show cumulative count of Article Views (full-text article views including HTML views, PDF and ePub downloads, according to the available data) and Abstracts Views on Vision4Press platform.
Data correspond to usage on the plateform after 2015. The current usage metrics is available 48-96 hours after online publication and is updated daily on week days.
Initial download of the metrics may take a while.