Fig. 6.
Download original image
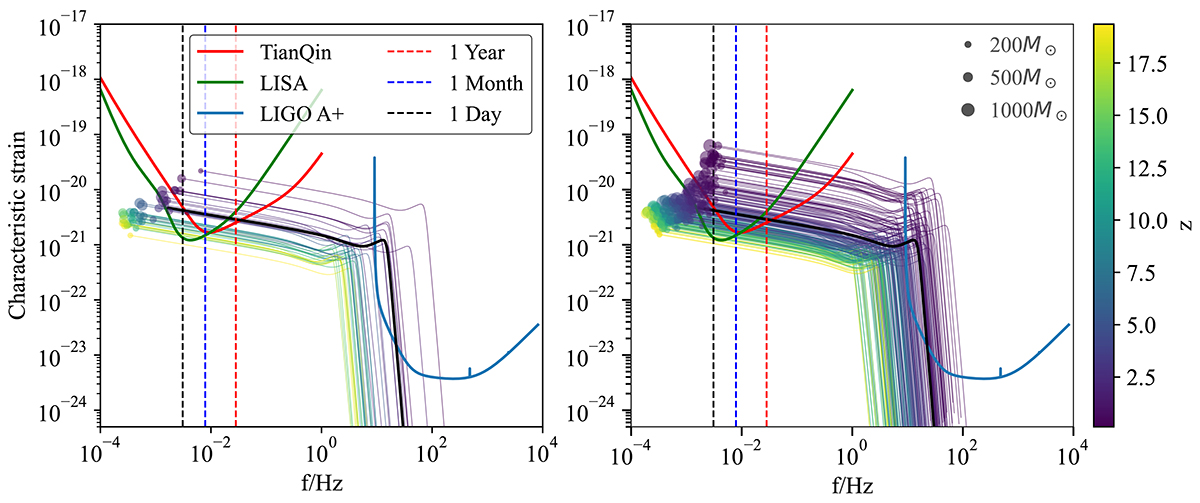
Sky-polarization-averaged GW signals of IMBBHs modeled with IMRPhenomD (thin lines), overlaid with TianQin (red), LISA (green), and LIGO A+ (blue) sensitivity curves. The merger time is set to 5 years. Dots size scale with total IMBBH mass. Left and right panels correspond to fb = 0 and fb = 1, respectively. The black solid line represents a reference IMBBH (m1 = m2 = 200, M⊙, z = 2, tc = 5 yr), with red, blue, and black dashed lines marking 1 year, 1 month, and 1 day before merger.
Current usage metrics show cumulative count of Article Views (full-text article views including HTML views, PDF and ePub downloads, according to the available data) and Abstracts Views on Vision4Press platform.
Data correspond to usage on the plateform after 2015. The current usage metrics is available 48-96 hours after online publication and is updated daily on week days.
Initial download of the metrics may take a while.