| Issue |
A&A
Volume 697, May 2025
|
|
|---|---|---|
| Article Number | A18 | |
| Number of page(s) | 9 | |
| Section | Extragalactic astronomy | |
| DOI | https://doi.org/10.1051/0004-6361/202453357 | |
| Published online | 30 April 2025 | |
A multi-scale investigation into the diagnostic potential of the HCN/HCO+ ratio for active galactic nucleus and starburst activity in nearby galaxies
1
Leiden Observatory, Leiden University, PO Box 9513 NL-2300 RA Leiden, The Netherlands
2
Transdisciplinary Research Area (TRA) ‘Matter’/Argelander-Institut für Astronomie, University of Bonn, Bonn, Germany
3
Physics and Astronomy, University College London, London, UK
⋆ Corresponding author: This email address is being protected from spambots. You need JavaScript enabled to view it.
Received:
9
December
2024
Accepted:
21
March
2025
Abstract
Context. The identification of active galactic nuclei (AGNs) and starburst (SB) regions in galaxies is crucial for understanding the role of various physical processes in galaxy evolution. Molecular line ratios, such as the HCN/HCO+ ratio, have been proposed as potential tracers of these distinct environments.
Aims. We aim to assess the reliability of the HCN/HCO+ ratio, from J = 1–0 to J = 4–3 transitions, as a diagnostic tool for differentiating AGN and SB activity across a diverse sample of nearby galaxies. We focus on evaluating the effect of spatial resolution on the robustness of these ratios and investigate the underlying physical conditions that drive observed variations.
Methods. We compiled observations of HCN and HCO+ lines across multiple J transitions from various sources, covering different galaxy types, including Seyferts, SBs, and (ultra-)luminous infrared galaxies. The observations span spatial scales from cloud-sized regions (tens of parsecs) to kiloparsec scales. We analysed the behaviour of these ratios at varying resolutions and employed non-local thermodynamic equilibrium (non-LTE) radiative transfer models to infer the physical conditions that drive the observed ratios.
Results. We find that the HCN/HCO+ ratio from higher J transitions (e.g. J = 4–3) can differentiate between AGN and SB activity when observed at high spatial resolution (< 100 pc). This distinction occurs around unity, with HCN/HCO < 1 observed in SB-dominated and > 1 in AGN-dominated regions. However, at lower resolutions, contamination from multiple emission sources and beam averaging effects destroy these distinctions. Radiative transfer modelling suggests that elevated HCN/HCO+ ratios in AGN-dominated regions are largely driven by an increase in HCN abundance relative to HCO+, likely due to high-temperature chemistry or increased excitation.
Conclusions. Our study confirms that the HCN/HCO+ ratio, particularly of higher J transitions, can be a reliable tracer of AGN versus SB activity if observations are conducted at sufficiently high spatial resolution. However, caution must be exercised in interpreting these ratios at larger spatial scales due to contamination effects. Further high-resolution observations are needed to refine the conditions under which these ratios can serve as reliable diagnostics.
Key words: astrochemistry / ISM: molecules / galaxies: active / galaxies: ISM / galaxies: Seyfert / galaxies: starburst
© The Authors 2025
 Open Access article, published by EDP Sciences, under the terms of the Creative Commons Attribution License (https://creativecommons.org/licenses/by/4.0), which permits unrestricted use, distribution, and reproduction in any medium, provided the original work is properly cited.
This article is published in open access under the Subscribe-to-Open model. This email address is being protected from spambots. You need JavaScript enabled to view it. to support open access publication.
1. Introduction
Understanding the processes that drive galaxy evolution is a key challenge in astrophysics, and differentiating between the influence of active galactic nucleus (AGN) and starburst (SB) activity is crucial to this endeavour. AGN and SB regions represent two dominant sources of energy in galaxies, each significantly impacting the physical and chemical environment of the interstellar medium (ISM). Identifying and characterising these regions helps unravel the mechanisms governing star formation, chemical enrichment, and feedback processes in galaxies.
Molecular line ratios have been used as a means of interpreting dense non-stellar gas environments, both galactic and extragalactic, for many years (Paglione et al. 1998; Kohno 2005; Izumi et al. 2016; Imanishi et al. 2023). For example, by comparing same-J molecular lines of molecules with similar intrinsic properties (i.e. the critical density, ncrit, or excitation temperature, Tex), one can probe additional properties of that environment, such as the cosmic ray ionisation rate and metallicity. These properties influence the excitation of these molecules within the ISM and thus the intensity of their transitions. HCN and HCO+ have been used in such a way for this very reason. As these molecules possess transitions with high critical densities, they trace the dense component of the gas within the ISM, such as in giant molecular clouds (GMCs). The excitation of these molecules within such regions is driven by collisions with H2 and radiative excitation (Shirley 2015). Kohno et al. (2001) first proposed the ‘HCN diagram’, which uses the HCN(1–0)/HCO+(1–0) and HCN(1–0)/ CO (1–0) ratios to differentiate between galaxies with prominent X-ray-dominated regions and SB galaxies (Kohno et al. 2003; Kohno 2005). The HCN/CO ratio has been used in recent years as a tracer of the dense gas fraction by making use of HCN’s notably higher critical densities, assuming the use of the same J transitions (e.g. Leroy et al. 2017). The critical densities of the J = 1–0 transitions of CO and HCN are 103 cm−3 and 105 cm−3, respectively (Flower 2001; Shirley 2015). The HCN/HCO+ ratio, across multiple J transitions, has been proposed as a means of tracing AGN versus SB activity (Loenen et al. 2007; Izumi et al. 2013, 2016; Butterworth et al. 2022), leading to varying results. HCN(1–0)/HCO+(1–0) does show some variance between certain AGN and SB environments, typically with HCN(1–0)/HCO+(1–0) > 1 in AGN- and < 1 in SB-dominated regions (Kohno 2005). Some studies have found that this is not always the case; for example, in a statistical study, Privon et al. (2020) surveyed a sample of 58 resolved, local luminous infrared galaxies (LIRGs) and ultra-luminous infrared galaxies (ULIRGs) and concluded that an increase in the HCN/HCO+(1–0) line ratio could not be shown to be correlated to the AGN activity and thus that HCN/HCO+ ratios are not a dependable method for tracing AGN regions located within galaxies. Butterworth et al. (2022) found that observations of HCN(1–0)/HCO+(1–0) were not able to accurately differentiate between regions located in the AGN-dominated gas of the circumnuclear disk (CND) of the nearby composite galaxy NGC 1068 and regions located in the galaxy’s SB ring. The higher J HCN(4–3)/HCO+(4–3) ratio, however, could be used to differentiate these regions at both higher and lower resolutions. Butterworth et al. (2022) also investigated other possible AGN activity tracers, such as HCN(4–3)/CS(7–6) and HCN(4–3)/CS(2–1), and found that HCN(4–3)/CS(2–1) could be used to distinguish between CND and SB regions at high resolution, but at low resolution the distinction was no longer clear. These results beg the question as to under which conditions and for which sources these ratios can be used as a tracer. Furthermore, understanding the situations in which these ratios are effective may provide a better understanding of the underlying physical and chemical processes responsible for the observed variations in these ratios.
In terms of physical processes that could lead to the observed increased intensity of HCN lines with relation to lines of similar properties (such as the same J HCO+ lines), high temperature reactions have been proposed to be responsible for the increase in HCN abundance observed in regions near AGNs within nearby extragalactic sources compared to sources within high star-forming regions, such as SBs (Izumi et al. 2016). This scenario is one whereby neutral-neutral reactions with high reaction barriers are more frequent (Harada et al. 2010), thus leading to a possible increase in HCN and depletion of HCO+ via newly available formation and destruction paths, respectively. Additionally, the higher temperatures could increase HCN excitation relative to HCO+ and CS, without necessarily changing their relative abundances (Imanishi et al. 2018). The results from Butterworth et al. (2022), who obtained column density estimates for HCN, HCO+, and CS within NGC 1068, imply that an increased HCN abundance is the driving factor. It must be noted, though, that the HCN/HCO+ ratio is dependent on multiple environmental properties, such as temperature and density, and thus efforts to overcome degeneracies should be made when conducting analyses using these ratios (Viti 2017; Butterworth et al. 2022).
While in Butterworth et al. (2022) the HCN/CS ratio, in particular HCN(4–3)/CS(2–1), showed some promise as a tracer of AGN versus SB activity at high resolution, there are currently not enough common-resolution observations of these lines across nearby galaxies for a homogeneous study to be conducted. As a result of the similar frequencies of same-J HCN and HCO+ lines, they are often covered in the same sideband of observations, resulting in a far larger available dataset in nearby galaxies at varying resolutions. We therefore performed a multi-scale, multi-source investigation into the use of HCN/HCO+ molecular line ratios in order to constrain the situations in which it is appropriate to use this ratio as a tracer of AGN or SB activity. This kind of study is necessary to overcome the bias inherent to single source and/or single spatial resolution studies.
In Sect. 2 we provide a summary of the data collated for this study. Section 3 presents an analysis of various molecular ratios at both high and low spatial resolution. In Sect. 4 we perform non-LTE analysis of the line intensities used for the ratios in Sect. 3. We do this as a means of investigating whether this analysis, which incorporates multiple ratios at once, can provide an understanding of the physical conditions leading to the trends observed in the intensity ratios, and whether the use of these models can help us more clearly distinguish between galactic types. We summarise our findings in Sect. 5.
2. Data
In total, this study examines a sample of 110 sources across 80 different galaxies, including multiple regions within the same galaxy. Our sample of galaxies are of numerous types (e.g. Seyfert, SB, (U)LIRG) and have been observed at various spatial resolutions. These variances of resolution, from sub-GMC scale to galactic scale, require that classification of each region. The type classification of sources in this paper depends on resolution: high-resolution observations reflect specific regions within a galaxy, while lower-resolution observations capture more global characteristics. The spatial resolutions of these observations range from cloud scale at 25 pc to galactic scale at 20 kpc, the details of these resolutions and how sources are grouped are described in Sect. 3. Classifications are taken either from the source of the data used or, in ambiguous cases, from the NASA/IPAC Extragalactic Database (NED; Helou et al. 1995). Taking NGC 1068 as an example, as a composite galaxy, NGC1068 contains both an AGN and a SB ring. With the use of high-resolution interferometers, like the Atacama Large Millimeter/submillimeter Array (ALMA), the emission from these regions (and even from prominent sub-regions within) may be obtained independently from one another. The full list of sources, their respective observed transitions of HCN and HCO+ along with their respective references are available from the CDS (see the ‘Data availability’ section).
In the case of observations of the same object with the same instrument at the same resolution, which resulted in similar intensities, only one result was included. In order to properly examine the effect upon the observed intensity ratio by the observational spatial resolution, we accumulated data for each source, grouped by spatial resolution. For some sources, similar (but not the same) spatial resolution observations have been grouped in one category, for varying or the same transition. Within each category, we then deconvolved the intensities by assuming the observation with the lowest resolution was the source size and using the equation
 (1)
(1)
where ISource is the source-averaged peak intensity, θs is the source size (as defined by the lowest-resolution observation in the category), θb is the beam size, and IBeam is the original intensity as defined in the archive or paper. This is the same approach as taken in Butterworth et al. (2022) and based upon the approach used to handle beam dilution taken in Kamenetzky et al. (2011) and Aladro et al. (2013, 2015). The spatial resolution bins were chosen in an effort to group observations based upon likely physical scales, while also maintaining a reasonably similar spatial resolution variation (< 2). As an example, a visual representation of the various scales covered by the observations utilised within this study are shown for the composite galaxy NGC 1068 in Appendix A.
3. Molecular line ratios
In this section we investigate how each J-transition ratio behaves within each respective resolution group before then evaluating the effect of the spatial resolution of the observation upon these ratios. HCN and HCO+ are tracers of dense gas, with their J = 1–0 rotational transition lines possessing critical densities of ∼105 cm−3 and ∼5 × 104 cm−3 (at ∼10 K, Shirley 2015), respectively. Thus, any observed variances in same-J transitions of these similar molecules can be used to trace unique processes that cannot be investigated in single molecule studies. Butterworth et al. (2022) found that HCN(4–3)/HCO+(4–3) ratios had the ability to clearly distinguish between AGN- and SB-dominated regions within NGC 1068. Therefore, in this section we discuss each ratio in turn, with a particular focus on how well the ratio separates AGN-dominated regions from SB-dominated regions. In the cases where (U)LIRG sources are present they are also discussed. We took the typical size of GMCs (tens of parsecs) as a somewhat arbitrary conceptual cutoff between what we refer to as ‘high’ resolution and ‘low’ resolution within this study.
3.1. Cloud-scale and higher resolution
First, we cover the molecular line ratios observed at ≲50 pc. The intensities for these sources have been taken from studies that use a beam size aperture comparable to the size of each region (see the ‘Data availability’ section). As such, sources such as NGC1808-ring are located within SB ring of NGC 1808 itself and is not an annuli encompassing the entire SB ring. The molecular line ratios from these sources are plotted in Figs. 1 and 2. We focused first on the highest-resolution group, up to 25 parsecs (Fig. 1). Here we possess an equal number of AGN and SB sources though only in the high-J, J = (3–2) and J = (4–3) ratios. As can be seen the HCN(4–3)/HCO+(4–3) ratio clearly separates the sources around unity, with AGN-dominated sources > 1 and SB-dominated sources < 1. This behaviour is consistent with the results of Butterworth et al. (2022). However, HCN(3–2)/HCO+(3–2), which has been observed in the torus of NGC 1068 and within the Circinus galaxy, may still trace AGN and SB activity, though with the distinction no longer occurring around unity.
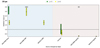 |
Fig. 1. Bar swarm plot of the HCN/HCO+ intensity ratios observed at ∼25 pc in regions of nearby galaxies. The colour of each bar indicates the corresponding J-transition of the HCN(J-(J–1))/HCO+(J-(J–1)) presented. |
Figure 2 shows the behaviour of these ratios at up to 50 parsec scale. The designated names for each sub-region within each galaxy are as defined in their original papers (see the ‘Data availability’ section for the table containing the reference of each source). The HCN(4–3)/HCO+(4–3) ratio at this resolution again very clearly separates SB-dominated sources and AGN-dominated sources, with the AGN- and SB-dominated sources each separated above and below 1, respectively. The HCN(1–0)/HCO+(1–0) ratio notably does not separate the two types of regions at this resolution. The HCN(1–0)/HCO+(1–0) is shown to be larger than 1 when observed in regions of the central molecular zone of NGC 253 (Meier et al. 2015; Butterworth et al. 2024). This is comparable to observations of this ratio at the AGN position of NGC 1068 at ∼50 pc that shows a value of unity. For each of these cases, there are possible explanations, at the AGN position there is a notable ‘cavity’ of emission from HCN and HCO+, likely resulting from the ionised gas outflow known to exist in NGC 1068 (García-Burillo et al. 2014; Huang et al. 2022; Vollmer et al. 2022). It is worthwhile to compare this observation to that of the higher-resolution observation of the torus of NGC 1068, whereby high-J transitions are also able to trace between AGN and SB regions. In the case of the central molecular zone of NGC 253, super star clusters (SSCs) are located within each of these observations; if high temperature chemistry resulting in an increased HCN abundance is a contributing factor, then the high temperature of these regions may result in an increase in this ratio (Rico-Villas et al. 2020, 2022; Butterworth et al. 2024). Regardless, these results concur with the results of Privon et al. (2020) that the HCN(1–0)/HCO(1–0)+ does not trace AGN activity unambiguously.
3.2. Extended resolution
At ∼100 pc and 500 pc scale, respectively, Figs. 3 and 4 represent an intermediate group of resolutions between cloud-scale and galactic scale observations. In this regime, contamination from multiple emission sources must be considered, affecting the reliability of molecular line ratios as tracers. As such, a new designation of composite (C) sources has been added to each plot. These are sources that contain both an AGN and a SB. This is particularly evident in Fig. 4, as at this resolution (∼500 pc) it is likely that the beam is no longer resolving a single source, such as a GMC. This is evident both in the variance between Figs. 3 and 4 and in how they compare to the higher-resolution observations covered in Figs. 1 and 2. At the ∼100 pc resolution shown in Fig. 3, it can be seen that the regions of the CND of NGC 1068, which were also present in Fig. 2, now show a greater homogeneity in the HCN(1–0)/HCO+(1–0) ratio at the AGN position, no longer appearing to be located around 1. This is likely a result of the observation extending beyond the cavity observed around the AGN of NGC 1068 within the CND. Observations of the SB ring of NGC 613 at this resolution appear to show that once again that HCN(1–0)/HCO+(1–0) does not clearly distinguish between AGN- and SB-dominated regions. Similarly, the HCN(4–3)/HCO+(4–3) ratio, though only observed in the CND and SB-ring of NGC613, at this resolution does not clearly trace either region. At the resolution covered by Fig. 4 (∼500 pc) significant contribution from multiple emission sources is likely. For example NGC 3351, though classified as a star-forming galaxy, shows a significantly high HCN(1–0)/HCO+(1–0) ratio of ∼1.7 Jiménez-Donaire et al. (2017), García-Rodríguez et al. (2023). This is consistent with Butterworth et al. (2022) in that ratios at high resolution that were once able to distinguish between AGN and SB activity, no longer maintain that diagnostic power at low resolution. This is also seen in overlap of ratios once lower-resolution observations of sources are considered by other studies, such as Izumi et al. (2016).
3.3. Galactic-scale resolution
Figures 5 and 6 contain primarily single-dish low-resolution observations of nearby galaxies. These observations, particularly in Fig. 6, begin to encompass entire galaxies, providing a general overview of global molecular gas distributions across the different galaxy types. As can be seen, at both ∼2 kpc (Fig. 5) and at ∼20 kpc 6 resolution, the distinction between AGN-dominated and SB-dominated regions has mostly broken down, particularly the distinction around unity observed in the cloud-scale observations. This trend appears to occur regardless of the chosen transition. This behaviour is to be expected as the resolution of the observations increase the contamination of multiple emission regions, alongside with possible dilution effects beginning to take hold. Of some note perhaps is the fact that in general, non-ULIRG galaxies with a known AGN appear to show ratio values greater than 1 regardless of transition, with a minor exception within errors for NGC 5194. This distinction, however, is undermined perhaps with the greater variance observed in the remaining galaxy types. These results agree with the ambiguity previously observed in smaller sample studies attempting to distinguish between AGN and SB galaxies on these scales, such as in Kohno (2005), Krips et al. (2008), and Israel (2023).
4. Non-LTE analysis
As shown by the line intensity ratios, the high-J transitions of HCN and HCO+ are able to distinguish between AGN and SB activity, at high resolution. In this section we explore, via the use of radiative transfer modelling, whether this is the result of an enhancement of HCN abundance with respect to HCO+, as was the conclusion in Butterworth et al. (2022) and other studies (Izumi et al. 2016; Imanishi et al. 2023).
To determine the physical conditions from each observation, we followed a similar methodology of combining SpectralRadex and UltraNest, as defined in Holdship et al. (2021), Huang et al. (2023), and Butterworth et al. (2024). SpectralRadex employs the use of the radiative transfer modelling code RADEX (van der Tak et al. 2007). The physical conditions constrained within our modelling are: neutral gas density (nH2), kinetic temperature (Tkin) and the total column density of both HCN and HCO+. The posterior probability distributions are obtained with the nested sampling Monte Carlo algorithm MLFriends (Buchner 2016, 2019). This algorithm has been integrated into our analysis by using the Python package UltraNest1 (Buchner 2021). We made the assumption that the prior distributions of our parameters are uniform or log-uniform; these priors are given in Table 1. These priors were chosen to sample a physically reasonable parameter range: a gas density, nH2, between 103 and 107 cm−3 covers the range of densities of gas in which we would expect HCN and HCO+, and this range also includes the critical densities of the transitions covered in this paper. The kinetic temperature range of 20–200 K was dictated by the range of temperatures covered by the collisional data of both HCN and HCO+, as sourced from the Leiden Atomic and Molecular Database (LAMDA; Denis-Alpizar et al. 2020; van der Tak et al. 2020; Navarro-Almaida et al. 2023). The column density ranges were chosen in an effort to cover the range of diffuse to dense regions possibly probed by such a study considering such varying spatial scales. We assumed that the uncertainty on our measured intensities, and thus ratios, are Gaussian such that the likelihood is given by  , where χ2 is the chi-squared statistic between our measured intensities and the RADEX output for each set of physical parameters θ. In order to obtain as many ratios as fitted parameters, we only performed this modelling on sources that have at least observations of two discrete J-transitions of HCN and HCO+ of the same source at the same resolution. We then fitted the respective HCN(J-(J-1))/HCO+(J-(J-1)) ratios along with the respective excitation ratios (e.g. HCN(J-(J-1)/HCN(I-(I-1), where J > I), thus obtaining at least four ratios for each source-resolution pair. This analysis offers an estimate of the average gas properties for each observation across our sources with multiple transitions, assuming that all the fitted transitions within resolution-source pair originate from the same gas component.
Parameter space allowed as a prior for the nested sampling of the HCN and HCO+ RADEX models across the various sources.
Figure 7 presents all of the ratios produced from the resulting column densities of HCN and HCO+ by the RADEX analysis. All the predicted column density results for each resolution for each source are shown together. The (nH2) and (Tkin) parameters have a known degeneracy in RADEX models resulting from the similar excitation conditions that can occur for molecules such as HCN and HCO+ within high-temperature, low-density and low-temperature high-density conditions (Viti 2017; Butterworth et al. 2022). As a result of this degeneracy, the focus of the discussion is upon the resulting column densities ratios. A representative posterior distribution resulting from the sampling of the CND-S region of NGC 1068 is provided in Appendix B.
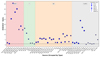 |
Fig. 7. Swarm plot of the resulting N(HCN)/N(HCO+) ratios obtained by fitting the observed intensity ratios of HCN and HCO+ to RADEX models. The dashed horizontal line shows the points at which N(HCN)/N(HCO+) = 1. The shape of each point shows the resolution at which the ratios were obtained. |
Considering each galaxy type first, we find that, generally, to explain the observed line intensities found in defined AGN-dominated systems, a high (≥15) N(HCN)/N(HCO+) ratio is required; this is the case for all sources, except the AGN position of NGC 1068. This source was remarked upon, particularly in relation to the NGC 1068 Torus observations that showed a higher HCN/HCO+ intensity ratio in J(3–2) but similar in the J(4–3) ratio. In fact, the column density ratios of HCN and HCO+ are similar in these two regions, with the low column density ratio of NGC1068-AGN resulting from the low intensity ratios observed at this resolution (see Sect. 3.1). The low NGC 1068 Torus N(HCN)/N(HCO+) ratio is likely driven by the similarly relatively low J(4–3) ratio observed in this region, when compared to other regions within the CND of NGC 1068. The ‘composite’ sources mostly comprise low spatial resolution (≥2000 pc) observations that encompass both an AGN and SB regions. As such, they do appear to reside in a middle ground between the AGN and SB regions.
Our SB group, consisting of the most discrete sources, is also the most consistent group in terms of predicted N(HCN)/N(HCO+) ratio, with all sources constrained to within one order of magnitude. For these sources, the resolution seems to have less of an impact on the predicted column density ratio. This is perhaps due to the fact that they do not experience the same ‘contamination’ effect from AGN activity. Finally, the (U)LIRG sources appear to mostly occupy the same range of column density ratio values as the SB sources, with the exception of 3 sources, IRAS 16090-0139, IRAS 22206-2715, and IRAS 22491-1808. These sources, each observed as a part of the work done by Imanishi et al. (2023), are notable for their relatively high HCN/HCO+ intensity ratios relative to the rest of the ULIRG sources. This clear enhancement of HCN relative to HCO+ within these sources is comparable to AGN sources at the same resolution. This implies that the enhancement of the HCN resulting from the AGN may be observed within certain AGNs at ∼500 pc. We note that chemical models have suggested that HCO+ may experience an enhancement in abundance via the destruction of CO with H3+ in regions of high cosmic ray ionisation rate, such as those predicted in ULIRGs (Klippenstein et al. 2010). The abundance of HCO+ as influenced by varying degrees of cosmic rays has been shown by models to be highly dependent on many factors, such as density, and may even result in an anti-correlation between cosmic ray ionisation rate and HCO+ abundance in some cases (Bayet et al. 2011; Meijerink et al. 2011; Gaches et al. 2019). Nevertheless, it is possible that the variations observed in the HCN/HCO+ ratio within different ULIRGs are in part a result of the increased abundance of HCN. More observations of these sources alongside more observations of HCN and HCO+ within ULIRGs may be necessary first before strong conclusions can be drawn.
5. Summary and conclusion
In this paper we have used observations of HCN/HCO+ ratios across many nearby extragalactic sources that are dominated by varying active processes (AGNs or star formation) at multiple spatial scales. Doing so has allowed us to more precisely define the conditions (e.g. the required spatial resolution and the type of source) under which the HCN/HCO+ ratio can be used as a tracer of AGN or SB activity. Furthermore, we also investigated whether radiative transfer modelling can be used to further distinguish between types of sources where intensity ratios cannot. Our main conclusions are as follows:
-
The intensity ratios of HCN/HCO+ appear to be able to trace AGN activity versus SB activity at approximately cloud-scale resolution (25–50 pc). At lower resolutions (> 100 pc), however, contamination from multiple emission sources leads to an evident stochastic nature of this ratio. This is particularly prominent in extremely low-resolution, approximately galactic-scale observations.
-
Of the HCN/HCO+ ratios, higher J transitions, such as J = 3–2 and J = 4–3, are favoured. Ratios of these transitions show the greatest trends away from unity, above in the case of AGN-dominated regions and below in the case of SB-dominated ones. This is consistent with the conclusions of Butterworth et al. (2022), who found HCN(4–3)/HCO+(4–3) to be a significantly better tracer than HCN(1–0)/HCO+(1–0) in NGC 1068.
-
Radiative transfer models were used to interpret the likely causes of the observed increase in HCN/HCO+ within AGN-dominated regions. As proposed and supported by previous studies, the likely cause is an increase in HCN abundance relative to HCO+ (Izumi et al. 2016; Imanishi et al. 2018). This theory is supported by our models. The AGN-dominated sources (with the exceptions located at the centre of NGC1068) all appear to show notable enhancements of HCN when compared to the SB sources.
-
ULIRG sources with multiple transitions of HCN and HCO+ show a similar trend of column densities as that of SB sources. Given the fact that there are some exceptions to this, this means that tracing the AGN activity of ULIRGs may be possible as long as one uses modelling. Consideration, however, must be given to other external properties likely to affect the HCN/HCO+ ratio within ULIRGs.
A further expansion of the number of same-J observations of HCN and HCO+ across nearby galaxies at the high resolutions available thanks to modern interferometers can only further inform us about the processes that produce the observed increased abundance of HCN in AGN-dominated regions. Furthermore, better understanding this relation may allow us to determine if it can be used for galaxies such as ULIRGs or whether its use should be restricted to cloud-scale active regions.
Data availability
A table of the data used throughout this paper is only available at the CDS via anonymous ftp to cdsarc.cds.unistra.fr (http://cdsarc.u-strasbg.fr) or via https://cdsarc.cds.unistra.fr/viz-bin/cat/J/A+A/697/A18.
Acknowledgments
This work is part of a project that has received funding from the European Research Council (ERC) under the European Union’s Horizon 2020 research and innovation programme MOPPEX 833460. This research has made use of the NASA/IPAC Extragalactic Database (NED), which is funded by the National Aeronautics and Space Administration and operated by the California Institute of Technology. The published data displayed in the following papers were used in this study: 1 – Sliwa & Downes (2017); 2 – Graciá-Carpio et al. (2008); 3 – Israel (2023); 4 – Kawamuro et al. (2019); 5 – Sato et al. (2022); 6 – Tristram et al. (2022); 7 – Nishimura et al. (2024); 8 – Tan et al. (2018); 9 – Imanishi et al. (2023); 10 – Aladro et al. (2015); 11 – Krips et al. (2008); 12 – Butterworth et al. (2022); 13 – García-Burillo et al. (2008); 14 – García-Burillo et al. (2019); 15 – Imanishi et al. (2020); 16 – Hsieh et al. (2012); 17 – Izumi et al. (2013); 18 – Imanishi & Nakanishi (2013); 19 – Ueda et al. (2021); 20 – Audibert et al. (2021); 21 – Butterworth et al. (2024); 22 – Meier et al. (2015); 23 – Jiménez-Donaire et al. (2017); 24 – Zhang et al. (2014); 25 – Audibert et al. (2019); 26 – Miyamoto et al. (2017); 27 – Izumi et al. (2015).
References
- Aladro, R., Viti, S., Bayet, E., et al. 2013, A&A, 549, A39 [NASA ADS] [CrossRef] [EDP Sciences] [Google Scholar]
- Aladro, R., Martín, S., Riquelme, D., et al. 2015, A&A, 579, A101 [NASA ADS] [CrossRef] [EDP Sciences] [Google Scholar]
- Audibert, A., Combes, F., García-Burillo, S., et al. 2019, A&A, 632, A33 [NASA ADS] [CrossRef] [EDP Sciences] [Google Scholar]
- Audibert, A., Combes, F., García-Burillo, S., et al. 2021, A&A, 656, A60 [NASA ADS] [CrossRef] [EDP Sciences] [Google Scholar]
- Bayet, E., Williams, D. A., Hartquist, T. W., & Viti, S. 2011, MNRAS, 414, 1583 [NASA ADS] [CrossRef] [Google Scholar]
- Buchner, J. 2016, Stat. Comput., 26, 383 [Google Scholar]
- Buchner, J. 2019, PASP, 131, 108005 [Google Scholar]
- Buchner, J. 2021, J. Open Source Softw., 6, 3001 [CrossRef] [Google Scholar]
- Butterworth, J., Holdship, J., Viti, S., & García-Burillo, S. 2022, A&A, 667, A131 [NASA ADS] [CrossRef] [EDP Sciences] [Google Scholar]
- Butterworth, J., Viti, S., Van der Werf, P. P., et al. 2024, A&A, 686, A31 [NASA ADS] [CrossRef] [EDP Sciences] [Google Scholar]
- Denis-Alpizar, O., Stoecklin, T., Dutrey, A., & Guilloteau, S. 2020, MNRAS, 497, 4276 [Google Scholar]
- Flower, D. R. 2001, J. Phys. B At. Mol. Phys., 34, 2731 [Google Scholar]
- Gaches, B. A. L., Offner, S. S. R., & Bisbas, T. G. 2019, ApJ, 878, 105 [NASA ADS] [CrossRef] [Google Scholar]
- García-Burillo, S., Combes, F., Graciá-Carpio, J., Usero, A., & Guélin, M. 2008, Ap&SS, 313, 261 [CrossRef] [Google Scholar]
- García-Burillo, S., Combes, F., Usero, A., et al. 2014, A&A, 567, A125 [Google Scholar]
- García-Burillo, S., Combes, F., Ramos Almeida, C., et al. 2019, A&A, 632, A61 [Google Scholar]
- García-Rodríguez, A., Usero, A., Leroy, A. K., et al. 2023, A&A, 672, A96 [NASA ADS] [CrossRef] [EDP Sciences] [Google Scholar]
- Graciá-Carpio, J., García-Burillo, S., & Planesas, P. 2008, Ap&SS, 313, 331 [CrossRef] [Google Scholar]
- Harada, N., Herbst, E., & Wakelam, V. 2010, ApJ, 721, 1570 [NASA ADS] [CrossRef] [Google Scholar]
- Helou, G., Madore, B. F., Schmitz, M., et al. 1995, in Information& On-Line Data in Astronomy, eds. D. Egret, & M. A. Albrecht, 203, 95 [Google Scholar]
- Holdship, J., Viti, S., Martín, S., et al. 2021, A&A, 654, A55 [NASA ADS] [CrossRef] [EDP Sciences] [Google Scholar]
- Hsieh, P.-Y., Ho, P. T. P., Kohno, K., Hwang, C.-Y., & Matsushita, S. 2012, ApJ, 747, 90 [Google Scholar]
- Huang, K. Y., Viti, S., Holdship, J., et al. 2022, A&A, 666, A102 [NASA ADS] [CrossRef] [EDP Sciences] [Google Scholar]
- Huang, K. Y., Viti, S., Holdship, J., et al. 2023, A&A, 675, A151 [NASA ADS] [CrossRef] [EDP Sciences] [Google Scholar]
- Imanishi, M., & Nakanishi, K. 2013, AJ, 146, 47 [Google Scholar]
- Imanishi, M., Nakanishi, K., & Izumi, T. 2018, ApJ, 856, 143 [Google Scholar]
- Imanishi, M., Nguyen, D. D., Wada, K., et al. 2020, ApJ, 902, 99 [CrossRef] [Google Scholar]
- Imanishi, M., Baba, S., Nakanishi, K., & Izumi, T. 2023, ApJ, 950, 75 [NASA ADS] [CrossRef] [Google Scholar]
- Israel, F. P. 2023, A&A, 671, A59 [NASA ADS] [CrossRef] [EDP Sciences] [Google Scholar]
- Izumi, T., Kohno, K., Martín, S., et al. 2013, PASJ, 65, 100 [NASA ADS] [Google Scholar]
- Izumi, T., Kohno, K., Aalto, S., et al. 2015, ApJ, 811, 39 [NASA ADS] [CrossRef] [Google Scholar]
- Izumi, T., Kohno, K., Aalto, S., et al. 2016, ApJ, 818, 42 [NASA ADS] [CrossRef] [Google Scholar]
- Jiménez-Donaire, M. J., Bigiel, F., Leroy, A. K., et al. 2017, MNRAS, 466, 49 [CrossRef] [Google Scholar]
- Kamenetzky, J., Glenn, J., Maloney, P. R., et al. 2011, ApJ, 731, 83 [NASA ADS] [CrossRef] [Google Scholar]
- Kawamuro, T., Izumi, T., & Imanishi, M. 2019, PASJ, 71, 68 [NASA ADS] [CrossRef] [Google Scholar]
- Klippenstein, S. J., Georgievskii, Y., & McCall, B. J. 2010, J. Phys. Chem. A, 114, 278 [Google Scholar]
- Kohno, K. 2005, in The Evolution of Starbursts, eds. S. Hüttmeister, E. Manthey, D. Bomans, & K. Weis, American Institute of Physics Conference Series, 783, 203 [Google Scholar]
- Kohno, K., Matsushita, S., Vila-Vilaró, B., et al. 2001, in The Central Kiloparsec of Starbursts and AGN: The La Palma Connection, eds. J. H. Knapen, J. E. Beckman, I. Shlosman, & T. J. Mahoney, Astronomical Society of the Pacific Conference Series, 249, 672 [NASA ADS] [Google Scholar]
- Kohno, K., Ishizuki, S., Matsushita, S., Vila-Vilaró, B., & Kawabe, R. 2003, PASJ, 55, L1 [Google Scholar]
- Krips, M., Neri, R., García-Burillo, S., et al. 2008, ApJ, 677, 262 [NASA ADS] [CrossRef] [Google Scholar]
- Leroy, A. K., Usero, A., Schruba, A., et al. 2017, ApJ, 835, 217 [NASA ADS] [CrossRef] [Google Scholar]
- Loenen, A. F., Baan, W. A., & Spaans, M. 2007, in Astrophysical Masers and their Environments, eds. J. M. Chapman, & W. A. Baan, 242, 462 [NASA ADS] [Google Scholar]
- Meier, D. S., Walter, F., Bolatto, A. D., et al. 2015, ApJ, 801, 63 [NASA ADS] [CrossRef] [Google Scholar]
- Meijerink, R., Spaans, M., Loenen, A. F., & van der Werf, P. P. 2011, A&A, 525, A119 [NASA ADS] [CrossRef] [EDP Sciences] [Google Scholar]
- Miyamoto, Y., Nakai, N., Seta, M., et al. 2017, PASJ, 69, 83 [CrossRef] [Google Scholar]
- Navarro-Almaida, D., Bop, C. T., Lique, F., et al. 2023, A&A, 670, A110 [NASA ADS] [CrossRef] [EDP Sciences] [Google Scholar]
- Nishimura, Y., Aalto, S., Gorski, M. D., et al. 2024, A&A, 686, A48 [NASA ADS] [CrossRef] [EDP Sciences] [Google Scholar]
- Paglione, T. A. D., Jackson, J. M., Bolatto, A. D., & Heyer, M. H. 1998, ApJ, 493, 680 [Google Scholar]
- Privon, G. C., Ricci, C., Aalto, S., et al. 2020, ApJ, 893, 149 [NASA ADS] [CrossRef] [Google Scholar]
- Rico-Villas, F., Martín-Pintado, J., González-Alfonso, E., Martín, S., & Rivilla, V. M. 2020, MNRAS, 491, 4573 [NASA ADS] [CrossRef] [Google Scholar]
- Rico-Villas, F., González-Alfonso, E., Martín-Pintado, J., Rivilla, V. M., & Martín, S. 2022, MNRAS, 516, 1094 [NASA ADS] [CrossRef] [Google Scholar]
- Sato, M. T., Aalto, S., Kohno, K., et al. 2022, A&A, 660, A82 [NASA ADS] [CrossRef] [EDP Sciences] [Google Scholar]
- Shirley, Y. L. 2015, PASP, 127, 299 [Google Scholar]
- Sliwa, K., & Downes, D. 2017, A&A, 604, A2 [NASA ADS] [CrossRef] [EDP Sciences] [Google Scholar]
- Tan, Q.-H., Gao, Y., Zhang, Z.-Y., et al. 2018, ApJ, 860, 165 [NASA ADS] [CrossRef] [Google Scholar]
- Tristram, K. R. W., Impellizzeri, C. M. V., Zhang, Z.-Y., et al. 2022, A&A, 664, A142 [NASA ADS] [CrossRef] [EDP Sciences] [Google Scholar]
- Ueda, J., Iono, D., Yun, M. S., et al. 2021, ApJS, 257, 57 [Google Scholar]
- van der Tak, F. F. S., Black, J. H., Schöier, F. L., Jansen, D. J., & van Dishoeck, E. F. 2007, A&A, 468, 627 [NASA ADS] [CrossRef] [EDP Sciences] [Google Scholar]
- van der Tak, F. F. S., Lique, F., Faure, A., Black, J. H., & van Dishoeck, E. F. 2020, Atoms, 8, 15 [Google Scholar]
- Viti, S. 2017, A&A, 607, A118 [NASA ADS] [CrossRef] [EDP Sciences] [Google Scholar]
- Vollmer, B., Davies, R. I., Gratier, P., et al. 2022, A&A, 665, A102 [NASA ADS] [CrossRef] [EDP Sciences] [Google Scholar]
- Zhang, Z.-Y., Gao, Y., Henkel, C., et al. 2014, ApJ, 784, L31 [NASA ADS] [CrossRef] [Google Scholar]
Appendix A: The scale of observations of NGC 1068
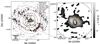 |
Fig. A.1. Visual representation of the approximate scales and regions covered by observations of the composite galaxy NGC 1068 as used within this study, plotted over the velocity-integrated moment 0 map of HCN (1–0) with a 3σ cutoff. |
Appendix B: The posterior distribution of the CND-S region of NGC 1068
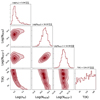 |
Fig. B.1. Resulting posterior distribution of the CND-S region of NGC 1068 as defined in Butterworth et al. (2022) across four parameters: kinetic temperature, neutral gas density, and the column densities of HCN and HCO+. |
All Tables
Parameter space allowed as a prior for the nested sampling of the HCN and HCO+ RADEX models across the various sources.
All Figures
|
Fig. 1. Bar swarm plot of the HCN/HCO+ intensity ratios observed at ∼25 pc in regions of nearby galaxies. The colour of each bar indicates the corresponding J-transition of the HCN(J-(J–1))/HCO+(J-(J–1)) presented. |
| In the text | |
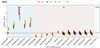 |
Fig. 2. Same as Fig. 1 but at ∼50 pc resolution. |
| In the text | |
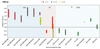 |
Fig. 3. Same as Fig. 1 but at ∼100 pc resolution. |
| In the text | |
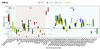 |
Fig. 4. Same as Fig. 1 but at ∼500 pc resolution. |
| In the text | |
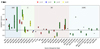 |
Fig. 5. Same as Fig. 1 but at ∼200 pc resolution. |
| In the text | |
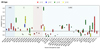 |
Fig. 6. Same as Fig. 1 but at ∼20 000 pc resolution. |
| In the text | |
|
Fig. 7. Swarm plot of the resulting N(HCN)/N(HCO+) ratios obtained by fitting the observed intensity ratios of HCN and HCO+ to RADEX models. The dashed horizontal line shows the points at which N(HCN)/N(HCO+) = 1. The shape of each point shows the resolution at which the ratios were obtained. |
| In the text | |
|
Fig. A.1. Visual representation of the approximate scales and regions covered by observations of the composite galaxy NGC 1068 as used within this study, plotted over the velocity-integrated moment 0 map of HCN (1–0) with a 3σ cutoff. |
| In the text | |
|
Fig. B.1. Resulting posterior distribution of the CND-S region of NGC 1068 as defined in Butterworth et al. (2022) across four parameters: kinetic temperature, neutral gas density, and the column densities of HCN and HCO+. |
| In the text | |
Current usage metrics show cumulative count of Article Views (full-text article views including HTML views, PDF and ePub downloads, according to the available data) and Abstracts Views on Vision4Press platform.
Data correspond to usage on the plateform after 2015. The current usage metrics is available 48-96 hours after online publication and is updated daily on week days.
Initial download of the metrics may take a while.