Open Access
Fig. A.1.
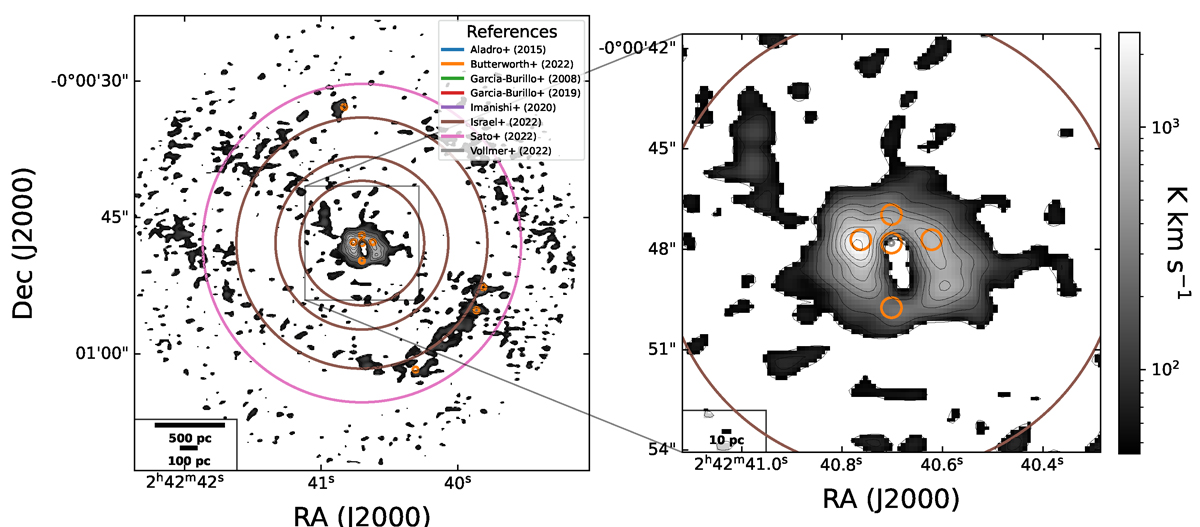
Download original image
Visual representation of the approximate scales and regions covered by observations of the composite galaxy NGC 1068 as used within this study, plotted over the velocity-integrated moment 0 map of HCN (1–0) with a 3σ cutoff.
Current usage metrics show cumulative count of Article Views (full-text article views including HTML views, PDF and ePub downloads, according to the available data) and Abstracts Views on Vision4Press platform.
Data correspond to usage on the plateform after 2015. The current usage metrics is available 48-96 hours after online publication and is updated daily on week days.
Initial download of the metrics may take a while.