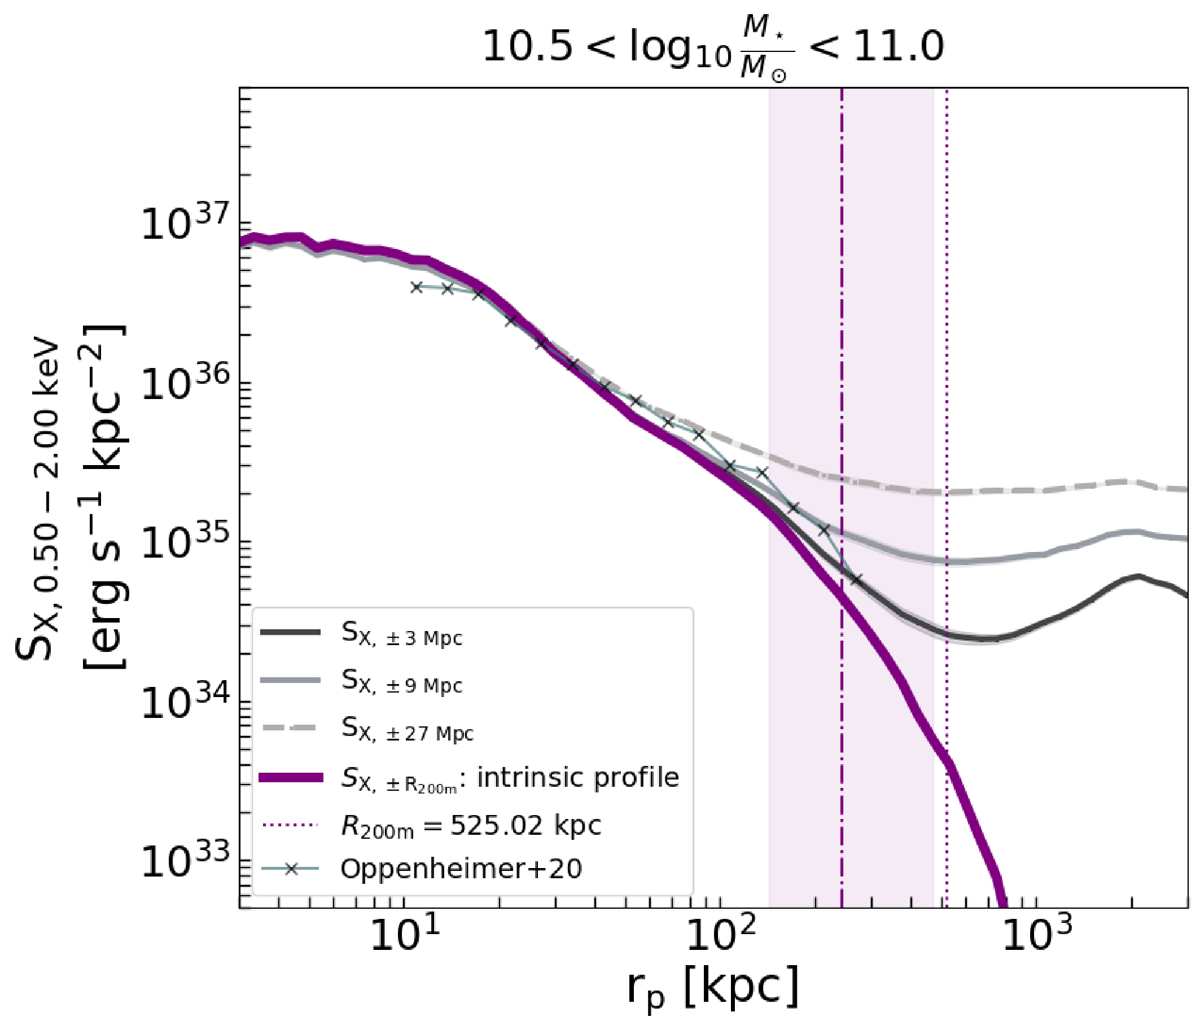
Fig. 6.
Download original image
Mean X-ray surface brightness profiles in the stellar mass bin M★=[1010.5, 1011] M⊙, corresponding to MW-like galaxies. The locally correlated large-scale structure contributions are shown by comparing the profiles obtained with photons selected within ±R200m (purple) and those obtained within ±3 Mpc (solid black), ±9 Mpc (solid grey), ±27 Mpc (dashed grey) away from the halo centre. The crosses are from previous work by Oppenheimer et al. (2020), where they generate mock X-ray observations using TNG-100. The vertical dashed line at 242 kpc and the dotted line at 525 kpc is the mean R500c and R200m, respectively, of the 5109 galaxies used in the mass bin with the shaded area corresponding to the minimum and maximum R500c values. The shaded uncertainties on the profiles represent the variance obtained by bootstrapping.
Current usage metrics show cumulative count of Article Views (full-text article views including HTML views, PDF and ePub downloads, according to the available data) and Abstracts Views on Vision4Press platform.
Data correspond to usage on the plateform after 2015. The current usage metrics is available 48-96 hours after online publication and is updated daily on week days.
Initial download of the metrics may take a while.