Fig. 11.
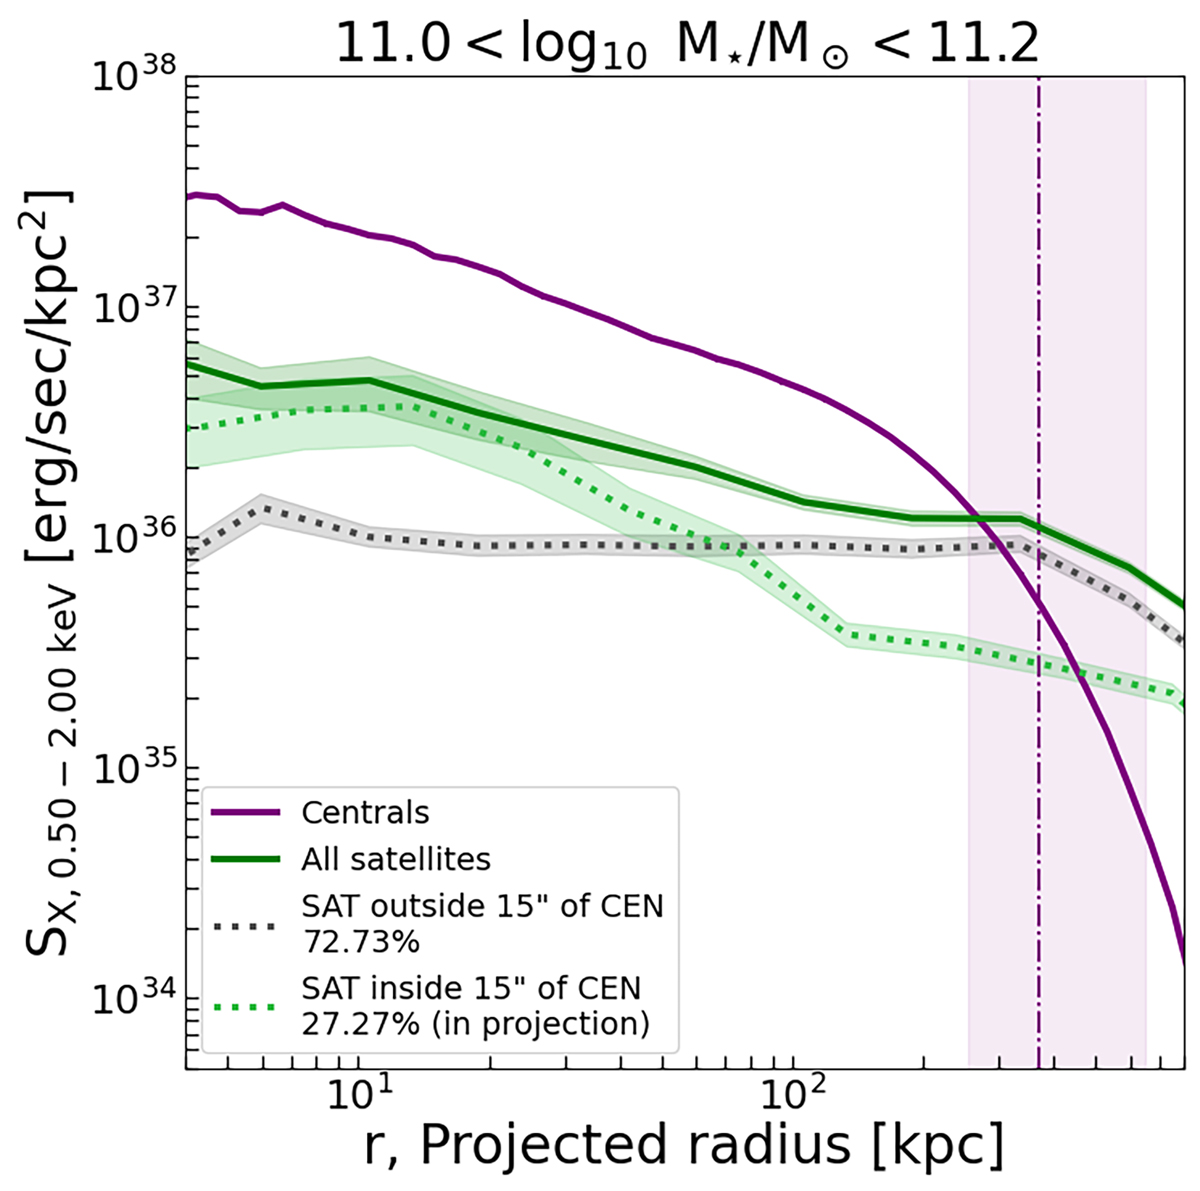
Download original image
Effect of further selection on the satellites misclassified as central galaxies on the X-ray surface brightness profile. The total population of satellites misclassified as centrals (solid green line) is divided into satellites within 15″ of a central (green dotted line) and satellites farther than 15″ from a central (grey dotted line) in projection on the sky. We show that satellites (misclassified as centrals) within 15″ of a central galaxy have a steeper profile than the case where we consider all the satellites, thereby reducing the overall flattening of the X-ray surface brightness profile due to misclassified centrals. Contrarily, the satellites farther than 15″ from a central have a constant surface brightness profile. The central galaxy profile is shown in purple. The vertical dashed line at 369 kpc is the mean R500c of the 680 galaxies used in the M31 stellar mass bin, and the shaded area corresponds to the minimum and maximum R500c value of the central galaxies in the M31-mass bin. The shaded uncertainties on the profiles represent the variance obtained by bootstrapping.
Current usage metrics show cumulative count of Article Views (full-text article views including HTML views, PDF and ePub downloads, according to the available data) and Abstracts Views on Vision4Press platform.
Data correspond to usage on the plateform after 2015. The current usage metrics is available 48-96 hours after online publication and is updated daily on week days.
Initial download of the metrics may take a while.