Fig. 53
Download original image
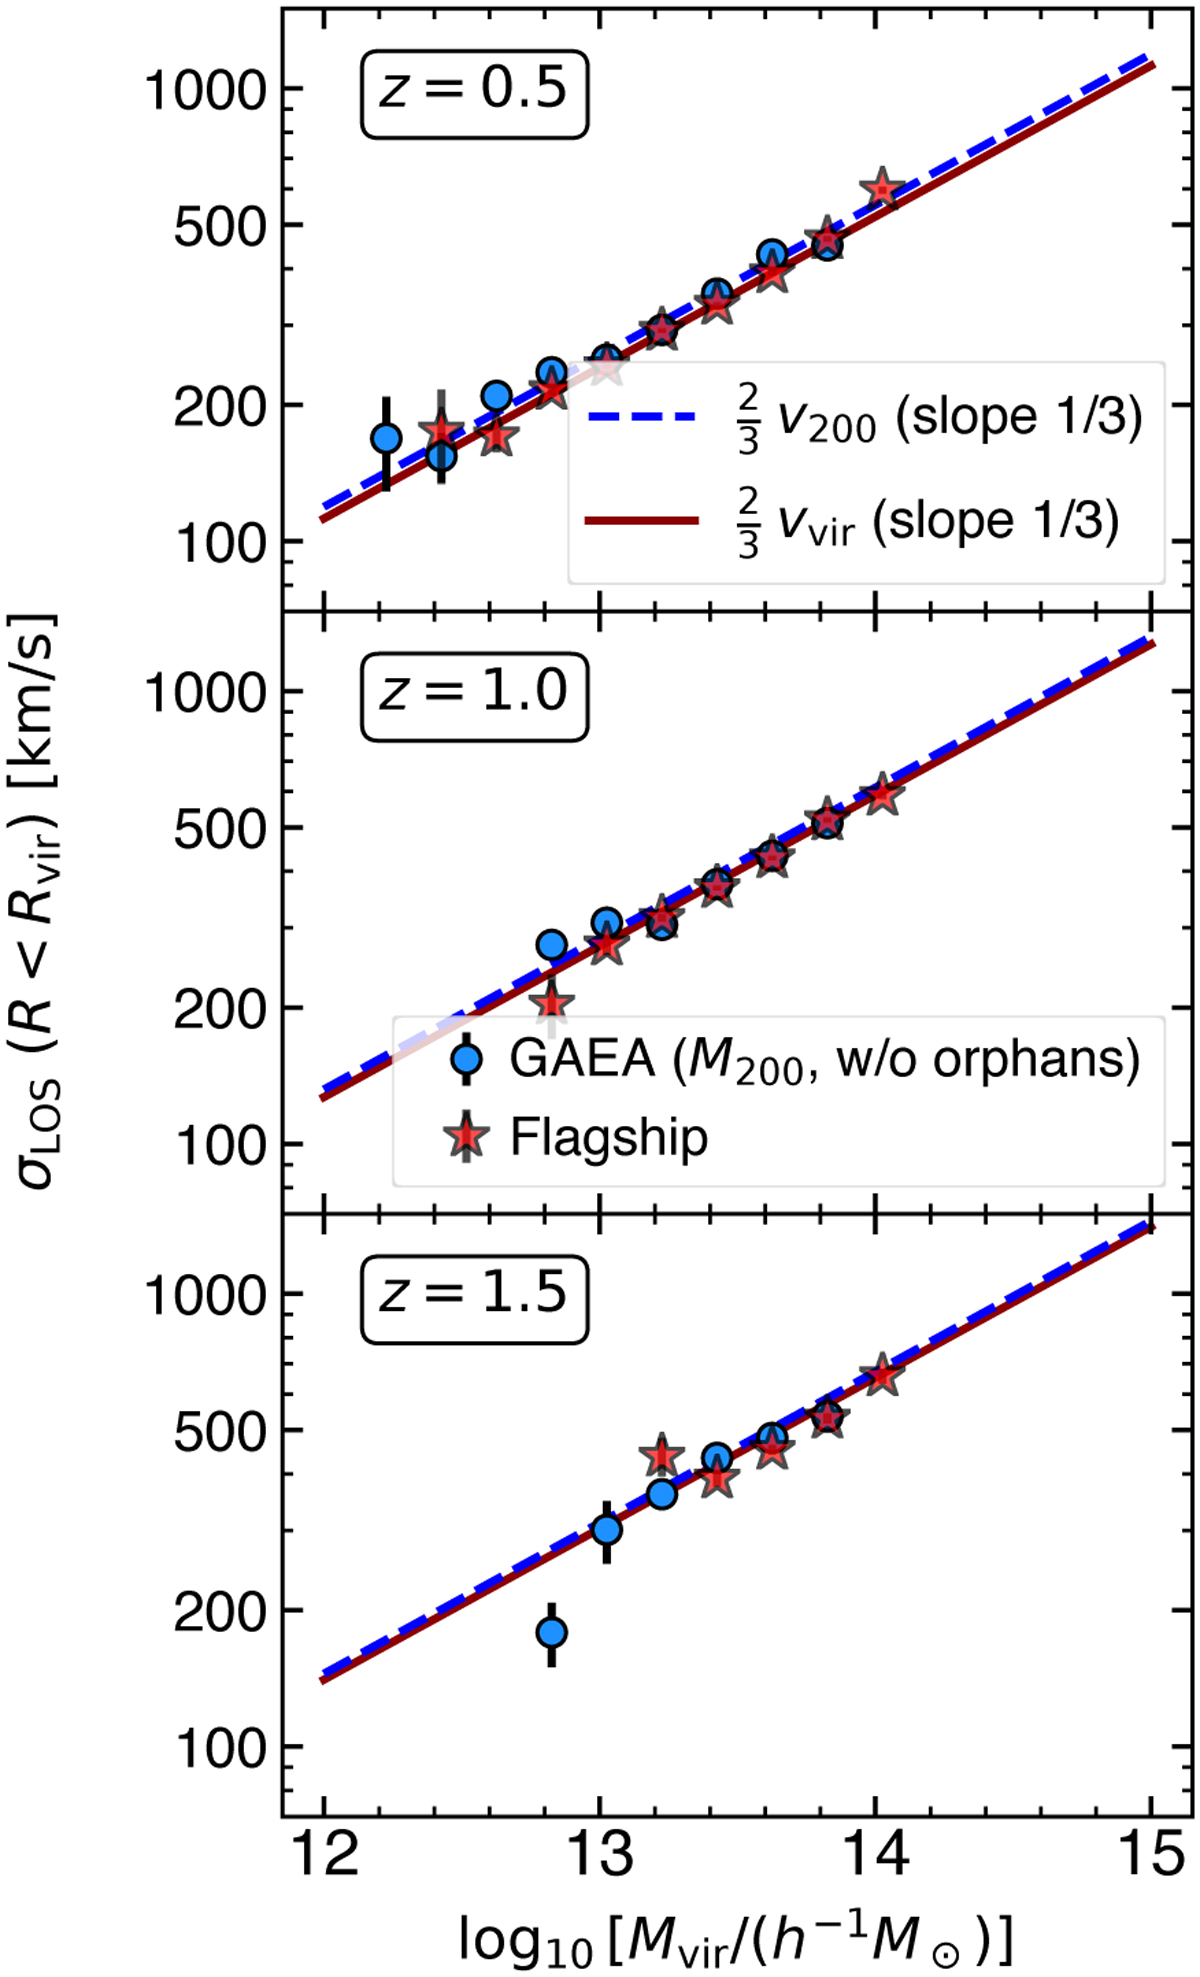
Halo line-of-sight velocity dispersion vs. halo mass, for lightcones from the GAEA semi-analytical model (without orphan galaxies, blue circles, 7 deg2) and for Flagship (red stars, here for the 49 deg2 region), at three representative redshifts. The lines are simple non-theoretical representations. While Flagship uses virial quantities, GAEA uses R200c for the virial radius and therefore the x axis is log10[M200c/(h−1 M⊙)] for GAEA. Only haloes with at least 10 member galaxies with IE < 24.5 and HE < 24 within the virial cylinder are considered, with at least 10 such haloes per mass bin. The velocity dispersions are measured with the gapper method (Wainer & Thissen 1976), and the error bars assume Gaussian velocity distributions, i.e., ![]() , where N is the number of galaxies per mass bin.
, where N is the number of galaxies per mass bin.
Current usage metrics show cumulative count of Article Views (full-text article views including HTML views, PDF and ePub downloads, according to the available data) and Abstracts Views on Vision4Press platform.
Data correspond to usage on the plateform after 2015. The current usage metrics is available 48-96 hours after online publication and is updated daily on week days.
Initial download of the metrics may take a while.