Fig. 52
Download original image
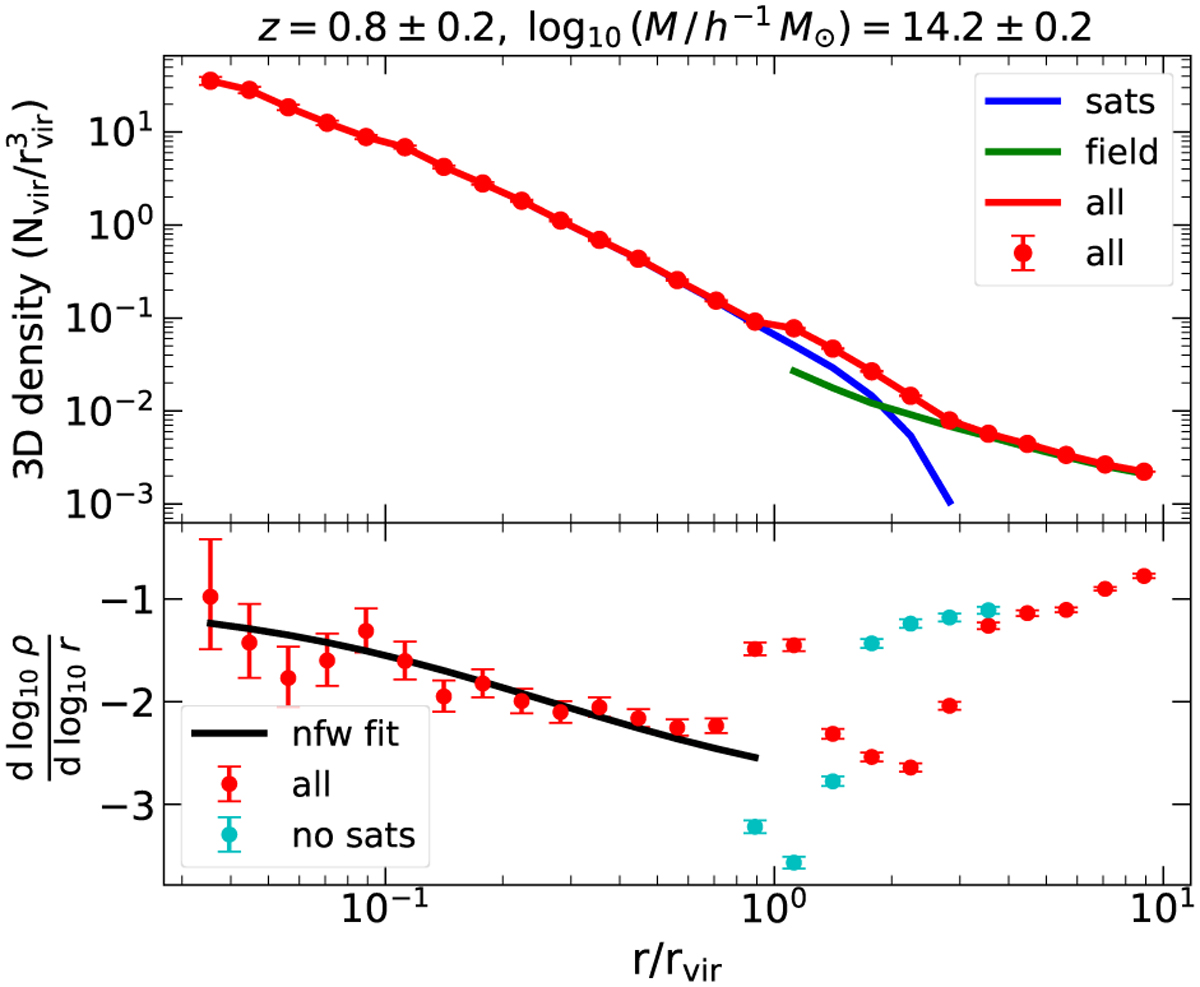
Galaxy distribution as a function of halo radius. Top: galaxy density profile as a function of halo-centric distance, showing the combined halo galaxy density profile and its transition into the field. We select 420 haloes with the same criteria as in Fig. 17 (0.6 < ɀ < 1.0 and 14.0 < log10[M/(h−1 M⊙)] < 14.4). The density for all galaxies is marked with red dots, whose error bars are small and hard to distinguish, and joined with a solid red line. The density for the satellites belonging to the halo (which are placed out to 3 rvir) are in blue and in green is the density of galaxies in the field (outside the halo). Bottom: slope of the galaxy density profile for all galaxies (red points with error bars) and the value of the slope of the NFW profile that best fits the density profile of all galaxies out to the virial radius. The cyan dots show the slope that we would get if we did not take into account the satellites of the haloes beyond the virial radius. In this case the splashback radius is clearly visible slightly beyond the virial radius. Both panels show that in the region between 1 and 3 virial radii we are overpopulating with galaxies.
Current usage metrics show cumulative count of Article Views (full-text article views including HTML views, PDF and ePub downloads, according to the available data) and Abstracts Views on Vision4Press platform.
Data correspond to usage on the plateform after 2015. The current usage metrics is available 48-96 hours after online publication and is updated daily on week days.
Initial download of the metrics may take a while.