Fig. 49
Download original image
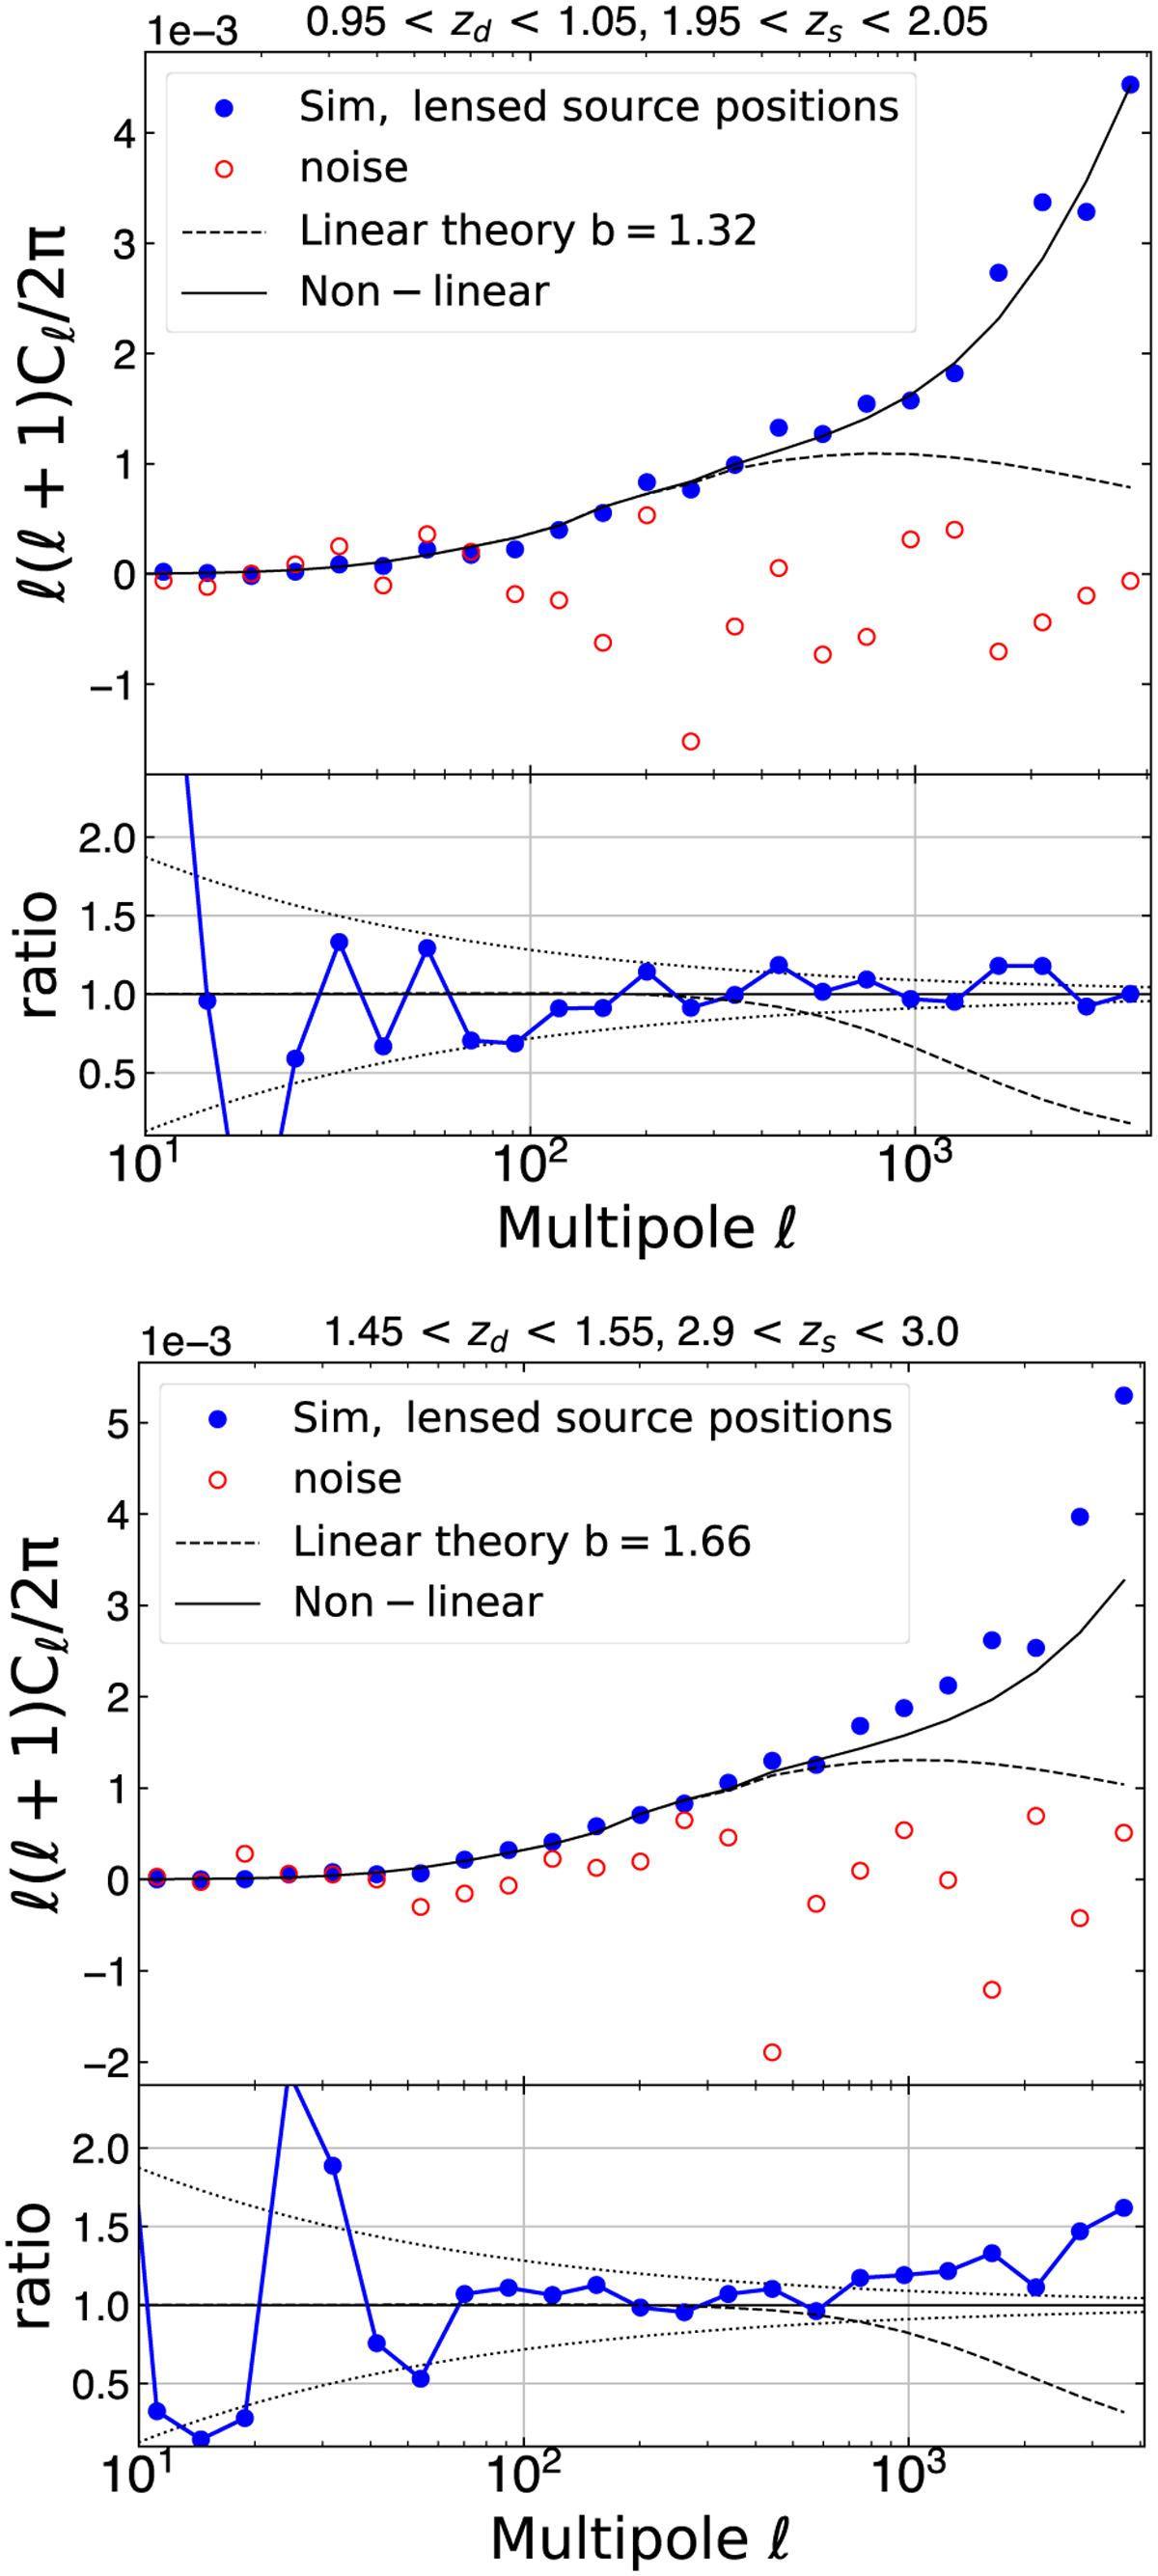
Lens-source cross-correlations as a test of source galaxy position deflections. We show two different lens-source ɀ-bin pairs for galaxy samples cut at IE < 26: a case with ɀd ≃ 1 and ɀs ≃ 2 in the top panel, ɀd ≃ 1.5 and ɀs ≃ 3 in the bottom panel, respectively. Flagship measurements (filled blue circles) are compared to linear and nonlinear theory predictions (lines). Lower panels show the ratio of FS2 measurements over nonlinear theory prediction. Sample variance errors around nonlinear theory are displayed as dotted lines. Cross-correlation in absence of magnification (i.e, noise estimate) is shown as open red circles. The FS2 measurements use an estimator that roughly cancels sample-variance (see text for details).
Current usage metrics show cumulative count of Article Views (full-text article views including HTML views, PDF and ePub downloads, according to the available data) and Abstracts Views on Vision4Press platform.
Data correspond to usage on the plateform after 2015. The current usage metrics is available 48-96 hours after online publication and is updated daily on week days.
Initial download of the metrics may take a while.