Fig. 47
Download original image
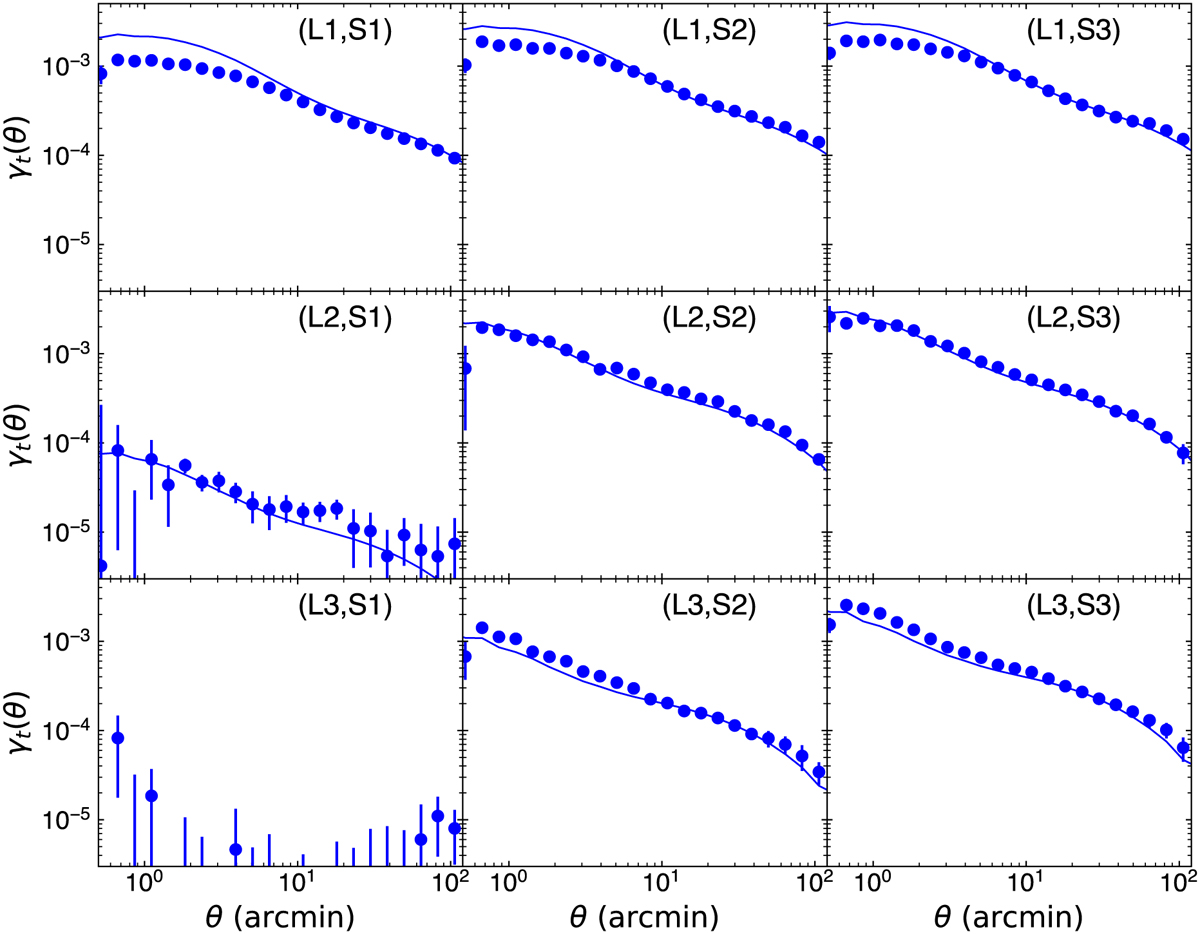
Average tangential shear for source samples in redshift bins (S1, S2, S3) = (0.95 < ɀ < 1.05,1.95 < ɀ < 2.05,2.9 < ɀ < 3), around the lens redshift slices (L1, L2, L3) = (0.45 < ɀ < 0.55,0.95 < ɀ < 1.05,1.45 < ɀ < 1.55. Panels show all possible combinations of cross-correlations between lens sample positions and source galaxy shear. Lens sample redshifts increase from top to bottom panels, whereas source redshift increases from left to right. Solid lines show a fiducial theory prediction for the nonlinear dark-matter power spectrum rescaled with a best-fit linear galaxy bias for the lens samples, b(L1) = 1.2, b(L2) = 1.45, b(L3) = 2.0.
Current usage metrics show cumulative count of Article Views (full-text article views including HTML views, PDF and ePub downloads, according to the available data) and Abstracts Views on Vision4Press platform.
Data correspond to usage on the plateform after 2015. The current usage metrics is available 48-96 hours after online publication and is updated daily on week days.
Initial download of the metrics may take a while.